Can option traders take a square root? Surprisingly, maybe not. This post shows that VIX futures prices exhibit significant deviations from their option-implied upper bounds—the square root of variance swap forward rates—thus violating the law of one price, a fundamental concept in economics and finance. The deviations widen during periods of market stress and predict the returns of VIX futures. Just as the stock market struggles with multiplication, the equity volatility market appears unable to take a square root at times.
The Law of One Price and Anomalies
The law of one price (LOOP) states that assets with identical payoffs must have the same price. If assets with identical payoffs have different prices, competitive traders will exploit the deviations to make arbitrage profits, thereby eliminating LOOP violations.
Financial markets are a prime testing ground for LOOP. With low transaction costs and the ability to buy and sell similar securities, traditional theories predict that LOOP should hold broadly across financial market settings. A growing literature, however, challenges this view. There are now well-documented examples of LOOP violations in equity, fixed income, credit, and currency markets.
Documenting LOOP violations improves our understanding of financial markets. When assets with closely related payoffs trade at significantly different prices for prolonged periods of time, there must be market frictions or inefficiencies that impede arbitrage activity, even for sophisticated traders and financial institutions. By uncovering these frictions, we can better interpret market prices and developments.
Equity Volatility No-Arbitrage Deviation Measure
This post and the associated staff report study relative pricing in equity volatility markets by comparing the prices of VIX futures to variance swap forward rates implied by S&P 500 index options (“synthetic variance swap forwards”). The VIX futures and index options markets provide a natural setting to test LOOP because they offer nearly redundant securities upon which arbitrage pricing places tight restrictions.
In particular, VIX futures pay the difference between the futures price and the VIX index at maturity. The VIX index is defined as the square root of a one-month synthetic variance swap rate. The swap rate is “synthetic” because it is computed from a portfolio of S&P 500 index options. This relationship binds together the pricing of VIX futures and index options.
It follows that VIX futures prices are bounded above by the square root of variance swap forward rates. This motivates defining the no-arbitrage deviation measure,

The deviation measure is the difference between the n month futures price and its upper bound, the one-month variance swap forward rate starting on the futures expiration date, expressed in annualized volatility units.
The deviation measure has a straightforward interpretation. When the measure is positive, the futures price is above its upper bound. This indicates a LOOP violation in which a trader can sell futures and pay fixed in forwards to lock in a riskless profit. When the deviation measure is negative and large in magnitude, the futures contract is cheap relative to the forward rate.
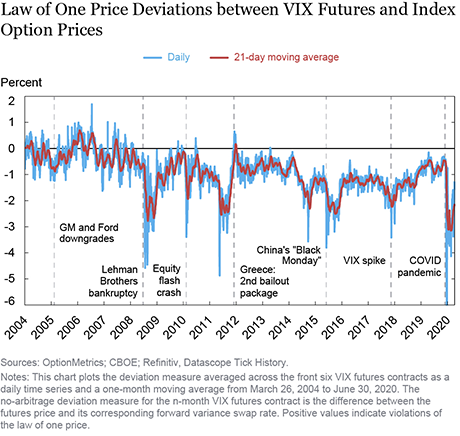
The chart below reports the deviation measure averaged across the front six futures contracts from March 26, 2004 to June 30, 2020. The deviation measure exhibits substantial variability over time. Positive deviations reveal the presence of LOOP violations. Negative deviations are often large in magnitude, sometimes more than 2-3 percent in size even after averaging across contracts.
To put the deviation measure in context, VIX futures bid-ask spreads have averaged around 0.05 percent in recent years. For the negative deviations, estimates of the difference between VIX futures upper and lower bounds are around 1.7 percent on average according to a dynamic term-structure model, indicating that many of the negative deviations are LOOP violations as well.
In addition to their large size, the chart reveals that the no-arbitrage deviations tend to decline around periods of increased systematic risk, such as the financial crisis and COVID-19 crisis, as well as high frequency events like the equity flash crash and VIX futures spike in February 2018. When risk increases, the decline in the deviation measure indicates that VIX futures prices increase by less than variance swap forward rates implied by index options.
Frequency of LOOP Violations
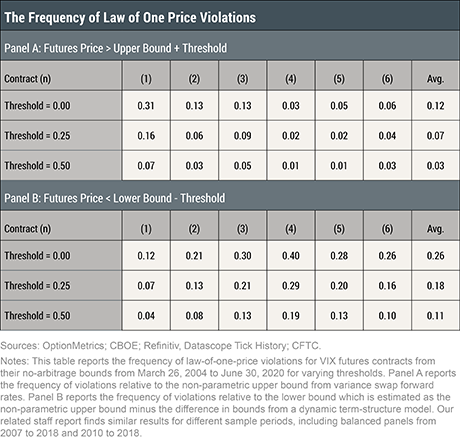
The table below presents the frequency of LOOP violations by contract for varying thresholds. Panel A shows that upper bound violations are most frequent for the front three contracts with LOOP violations on more than 10 percent of days. Panel B shows that lower bound violations are most frequent for longer-dated contracts and occur for around 25 percent of observations. The lower bound is estimated as the option-implied upper bound minus the difference in upper and lower bounds from a term-structure model.
The results indicate that VIX futures exhibit frequent LOOP violations relative to their no-arbitrage bounds that persist even for large thresholds. The staff report provides further evidence that the deviation measure is identifying an arbitrage spread by showing that the deviation measure robustly predicts the returns of VIX futures in excess of variance swap forwards.
Deviation Measure versus Risk and Demand
What drives the deviation measure and law of one price violations? If arbitrageurs are risk averse or have limited capital, demand shocks can push prices away from fundamental values. In addition, when risk increases, financing constraints may bind more tightly and force arbitrageurs to exit positions.
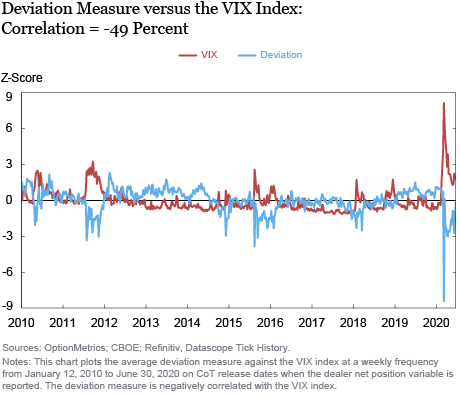
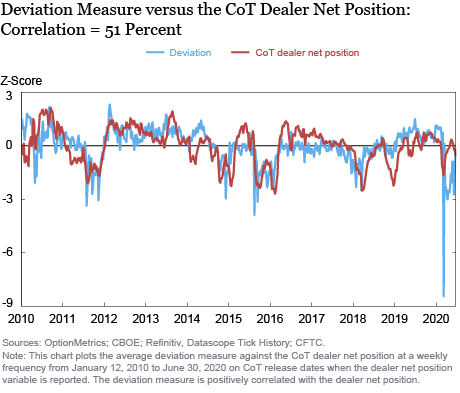
The plot below investigates how the deviation measure relates to risk and demand factors. It plots the average deviation against the VIX Index and dealer net position in VIX futures from the Commodity Futures Trading Commission’s Commitment of Traders Report (CoT Report) normalized by open interest. While the VIX index is a well-known risk factor, previous studies highlight dealer net positions in VIX futures as an important demand variable that affects futures prices and risk premia, and potentially serves as a veil for retail hedging demand for VIX Exchange-Traded-Products (ETPs).
The plots suggest that the deviation measure is decreasing in systematic risk and increasing in demand to buy VIX futures. Since the deviation measure tracks the difference in prices for nearly identical claims across two markets, it is surprising to find a negative relationship with risk, as risk should play a similar role in both markets. One hypothesis for the results is that hedgers may take profit on long positions in VIX futures when risk increases, leading to demand shocks that are correlated with increases in systematic risk. The staff report provides vector autoregression and panel regression analysis that finds support for this hypothesis.
Deviation Measure during COVID-19 Pandemic
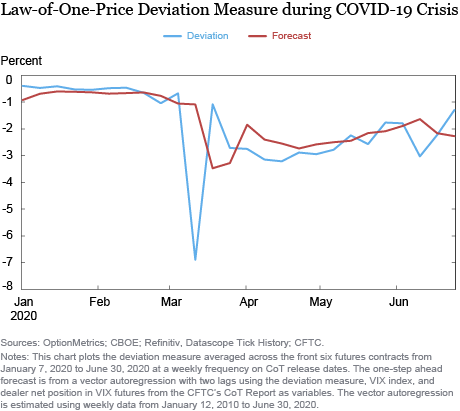
How did the deviation measure react during the COVID-19 pandemic? The figure below plots the deviation measure averaged across contracts against a one-week ahead forecast from a vector autoregression with the VIX index and dealer net position in VIX futures as variables. The deviation measure exhibited a muted response during the early stages of the pandemic, similar to the finding from a related article showing that VIX futures did not anticipate or provide early warnings signs for how much the VIX index would increase. Even as the VIX increased from about 15 on February 18 to 47 on March 10, the deviation measure remained in line with the forecast. It was not until the VIX index reached all-time highs in mid-March that the deviation measure declined significantly and produced a large forecast error. After March, the deviation measure remained low throughout April and early May and tended to surprise to the downside compared to the forecast, indicating even larger dislocations than usual in the relative pricing of VIX futures and index options.
Conclusion
In summary, VIX futures exhibit systematic LOOP deviations from index options. This result is surprising because the no-arbitrage relationship behind the deviation measure is well known to option traders. The evidence suggests that the deviations are related to systematic risk and demand pressure. During the COVID-19 crisis, the deviations widened to all-time lows and revealed the presence of large dislocations in the relative prices of VIX futures and index options that persisted into June 2020.

Peter Van Tassel is an economist in the Federal Reserve Bank of New York’s Research and Statistics Group.
Charles Smith is a senior research analyst in the Bank’s Research and Statistics Group.
How to cite this post:
Peter Van Tassel and Charles Smith, “The Law of One Price in Equity Volatility Markets,” Federal Reserve Bank of New York Liberty Street Economics, February 1, 2021, https://libertystreeteconomics.newyorkfed.org/2021/02/the-law-of-one-price-in-equity-volatility-markets.html.
Disclaimer
The views expressed in this post are those of the authors and do not necessarily reflect the position of the Federal Reserve Bank of New York or the Federal Reserve System. Any errors or omissions are the responsibility of the authors.


 RSS Feed
 Follow Liberty Street Economics