Since the depths of the Great Recession, household debt has increased from a low of $11 trillion in 2013 to more than $14 trillion in 2020 (see the New York Fed Household Debt and Credit Report). In this post, we examine how consumers’ repayment priorities have evolved over that time. Specifically, we seek to answer the following question: When consumers repay some but not all of their loans, which types do they choose to keep paying and which do they fall behind on?
We use data from the New York Fed’s Consumer Credit Panel to construct a “head-to-head conflict” among different types of debt. In other words, if a consumer chooses to repay all of their auto loans, while defaulting on their consumer debt, that would constitute a “win” for auto loans over consumer debt. We then run a logistic regression to predict the overall strength of each debt type, focusing on three categories: auto loans, mortgages, and consumer debt (we have excluded student debt from the analysis because substantial changes in repayment rules—such as the dramatic rise of income-based repayment plans—might make comparisons over the full twenty-year period difficult.
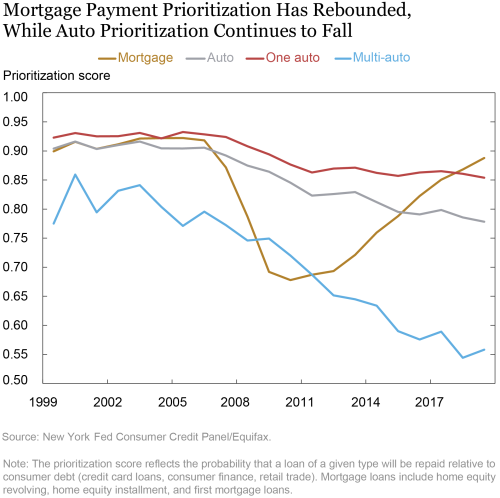
The chart below illustrates repayment prioritization over the last twenty years (because of the rise in mandatory and voluntary forbearance programs during the COVID pandemic, we exclude 2020 data). The y-axis represents the probability that a given form of debt will be repaid over consumer debt (which includes bank card, consumer finance, and retail trade debt) when a consumer must choose to fall behind on at least one form of debt. Two dominant patterns emerge. The first, as previously explored in a Liberty Street Economics blog post, is that mortgage prioritization collapsed during the 2008 financial crisis, before steadily climbing back to its previous peak in the last few years.

The Decline of Auto Prioritization Rates
The second dominant pattern is that in the last fifteen years auto loan prioritization has inexorably declined, falling far below parity with mortgages by 2020. The intersection of the mortgage (gold) and auto (gray) lines implies that consumers are equally likely to choose to repay their mortgage or their auto loans when they only repay one. This trend parallels a previously reported surge in outstanding subprime auto debt and a consequent increase in default rates.
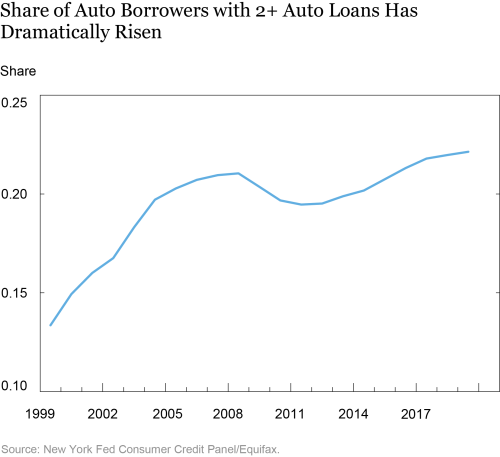
One reason is the growth in borrowers with multiple auto loans. The chart above makes clear that those with multiple loans (blue line) prioritize auto payment even less than those with a single car loan (red line). Presumably, the potential loss of one’s second car is less devastating than the loss of one’s only vehicle. As seen in the chart below, the share of borrowers taking out multiple auto loans has increased roughly 72 percent over the sample period. However, compositional shifts toward multi-auto loan borrowing cannot explain the full decline, as rates of prioritization within the single-loan and multi-loan cohorts have fallen. Indeed, increased frequency of multiple-auto borrowers can explain roughly 40 percent of the decline in the overall auto prioritization decline pre-2007, but only 10 percent of the decline after 2007.

We investigate several other factors, none of which are sufficient to explain the decline in isolation. The first is an aging population; older adults tend to drive less and consequently de-prioritize auto loan repayment. The share of elderly auto-loan borrowers (75+) has grown, topping out at 4.5 percent in 2020 vs 2.5 percent in 2007. Hence aging can explain only a small fraction of the overall trend.
We also investigate urbanization patterns. Borrowers in highly urbanized census tracts hold similar priorities to borrowers in rural tracts, despite the potentially higher levels of access to alternative forms of transportation.
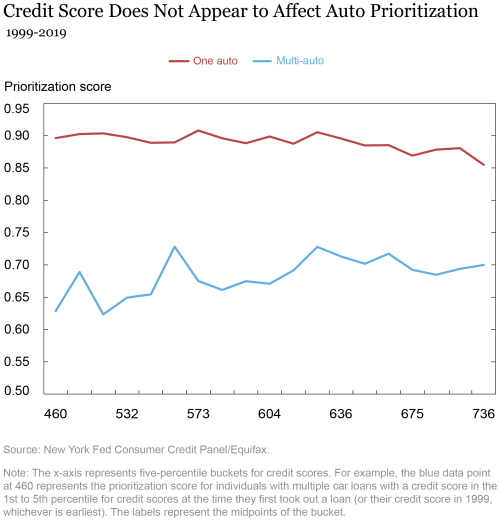
Finally, we investigate changes in lending standards. Empirically, we don’t see a substantial difference in prioritization scores between borrowers with low credit scores at the time of their first loan and those with higher credit scores (see chart below), making it an unlikely culprit. So while credit score may predict default, it does not appear to have much bearing on households’ prioritization conditional on default.
One avenue for future exploration might be to examine the relationship between prioritization and changes in interest rates. It is possible that borrowers with higher rates might choose to prioritize those debts for fear of the heightened consequences of falling further behind. Indeed, according to data from the Federal Reserve, the average interest rate on a new 48-month auto loan from a commercial bank has declined from 6.61 percent in August 2009 to 4.98 percent in August 2020 whereas credit card rates have risen from 13.71 percent to 14.58 percent over the same time period.

Takeaways
Household debt prioritization has been surprisingly dynamic over the past twenty years. A key factor appears to be the value of the underlying collateral to the household. Low home equity reduced the incentive to prioritize mortgage debt following the Great Recession and the growing prevalence of a second car loan lowered the importance of remaining current on the additional automobile. However, other factors, including demographics and relative pricing, also appear to influence households’ decisions. We hope to further understand these forces in future research.
William J. Arnesen is a senior research analyst in the Federal Reserve Bank of New York’s Research and Statistics Group.
Jacob Conway is a Ph.D. candidate in economics at Stanford University and a former senior research analyst at the New York Fed.
 Matthew Plosser is an officer in the Federal Reserve Bank of New York’s Research and Statistics Group.
How to cite this post:
William J. Arnesen, Jacob Conway, and Matthew Plosser, “Who Pays What First? Debt Prioritization during the COVID Pandemic,” Federal Reserve Bank of New York Liberty Street Economics, March 29, 2021, https://libertystreeteconomics.newyorkfed.org/2021/03/who-pays-what-first-debt-prioritization-during-the-covid-pandemic.html.
Related Reading
When Debts Compete, Which Wins?
CMD: Household Debt and Credit Report
Disclaimer
Conway’s contributions are based upon work supported by the National Science Foundation Graduate Research Fellowship Program under Grant No. DGE-1656518. Any opinions, findings, and conclusions or recommendations expressed in this material are those of the authors and do not necessarily reflect the views of the National Science Foundation, or the position of the Federal Reserve Bank of New York or the Federal Reserve System. Any errors or omissions are the responsibility of the authors.


 RSS Feed
 Follow Liberty Street Economics
It’s a trillion dollar question and not an easy one to answer as the prioritization seems to be fluid: easier to explain with the benefit of hindsight than to forecast it. Given the sharp increase in mortgage prioritization since 2008 (probably all due to positive equity and tighter underwriting), it would be interesting to see the prioritization during 2020 despite the flexibility afforded by the government and the servicers.