Editor’s note: When this post was first published, the average credit score increase for mortgage borrowers who took forbearance was misstated; the post has been corrected to reflect the correct figure of 14 points. (May 19, 1pm)
We’ve spent the first three posts of this series discussing who has entered mortgage forbearance, and how their personal finances have developed during the course of the pandemic. In this fourth and final post, we will use Consumer Credit Panel (CCP) data to examine the profiles of those who remain in forbearance and those who have exited, and how the performance of household credit may evolve as the force of the pandemic begins to ebb and the economy reopens and normalizes.
Nearly Two-Thirds of Forbearance Participants Left Forbearance by March 2021
Many mortgage borrowers have entered and exited forbearance during the course of the pandemic, and we find that 13 percent of all mortgage borrowers were in forbearance for at least one month during the past year and 35 percent of those participants were still in forbearance as of March 2021.
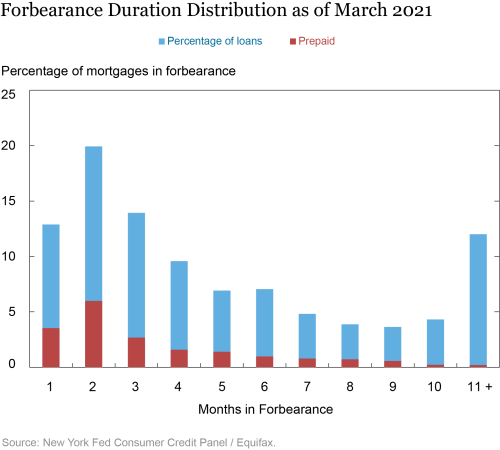
The CARES Act forbearances were initially allowed for a six-month forbearance, with twelve months of additional extensions. So far, the average participant spent five months in forbearance, but as we show in the chart below, a third of participants were in forbearance for only one to two months, and twelve percent of borrowers have taken advantage of the maximum possible forbearance of eleven to twelve months.
Many borrowers have exited forbearance by selling their property, with the benefit of home equity at an all-time high in nominal terms, according to the Financial Accounts of the United States. This escape route was not available to troubled borrowers during the Great Recession, when a collapse in home prices left a foreclosure or a short sale as the only potential exits from an underwater mortgage. The orange sections of the bars below indicate borrowers that were in forbearance for that number of months but have since prepaid their mortgages—likely by either moving, or refinancing. Note, however, that refinancing may have been a more likely option among those with shorter forbearance durations due to agency requirements (FHA, Fannie, Freddie).
Lower Income Borrowers More Likely to Stay in Forbearance
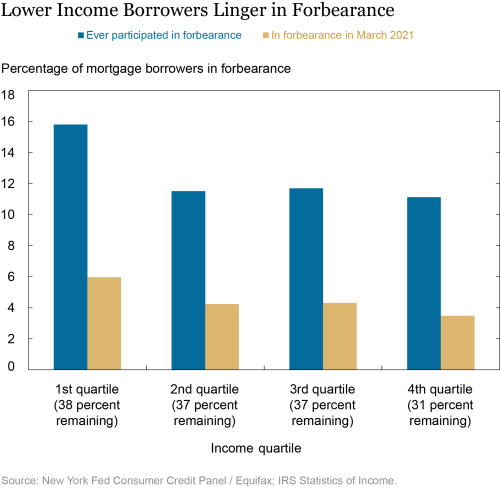
As we discussed in the first post in this series, borrowers living in the lowest income areas were more likely to have ever entered forbearance, with nearly 16 percent of those mortgagors having entered forbearance at some point. By contrast, in the highest income areas, 11 percent of mortgagors had participated in a forbearance. Across all groups, just about a third of mortgagors remained in forbearance as of March 2021.
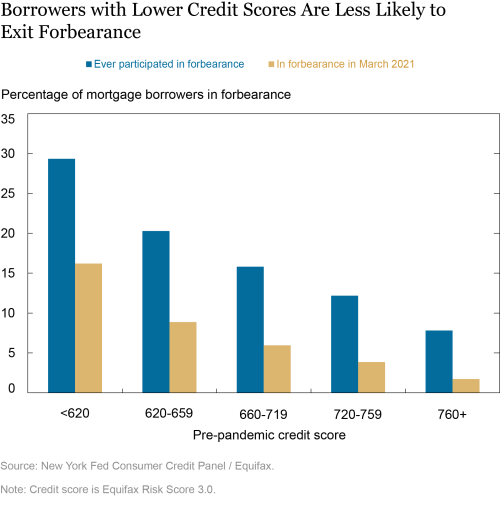
Borrowers with the highest pre-pandemic credit scores were least likely to ever enter forbearance, while nearly 30 percent of lower credit score mortgagors entered mortgage forbearance at some point in the past year. And more than half of them remained in forbearance as of March 2021, while only one quarter of the highest score borrowers were still in forbearance.
Credit Score Increases for Forbearance Participants
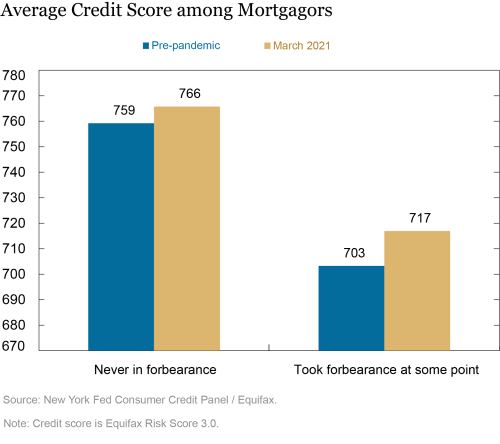
With forbearance protecting borrowers from damaging delinquencies due to missed payments, average credit scores have grown faster in the past year—a phenomenon we see in our data (using Equifax Risk Scores).
Most mortgage borrowers who took forbearances have seen increases in their credit score since March of 2020 —in fact, the average credit score has increased by 14 points since then. But the increases are larger at the lower end of the credit score distribution, with subprime mortgagors with scores below 620 seeing a 57-point increase in their scores over the past year, on average. Those who never took a forbearance in the pandemic saw their credit scores rise too–by 7 points—since having a lengthier payment history helps increase the creditworthiness of a borrower. Interestingly, the credit score increase is higher among forbearance takers. This is because although they were not making payments, their credit reports are treated as if they’re making continued payments for credit scoring purposes and account histories. A regular payment history provides a boost, particularly to those who started with a lower credit score and whose reports may have previously been plagued by missed payments. So, at the end, this brings two messages: on the one hand, it is good for the borrowers in forbearance not to suffer credit score-wise from missed payments. On the other hand, the concept of the credit score, a device to distinguish good borrowers from bad borrowers, may lose some of its power in signaling creditworthiness to lenders, at least for some time.
What to Expect for Those Remaining in Forbearance
By March 2021, the characteristics of borrowers remaining in forbearance were considerably different than they had been twelve or even six months earlier. Many of the most “advantaged” forbearance participants—those more likely to have entered forbearance with a higher credit score or from a non-delinquent mortgage status—have already left. The remaining pool of forborne borrowers is almost certainly more vulnerable to delinquency once the forbearance programs come to an end. One manifestation of this is that their payment rate is lower than the payment rate of those who exited forbearance more quickly. As a result, in March, over 70 percent of borrowers in forbearance were not making payments, a higher share than any month in 2020.
A simple and conservative way of thinking about how the end of forbearance might play out from a risk perspective is to assume that those borrowers not making payments will be at severe risk of entering serious delinquency at the program’s conclusion. This amounts to about 2.9 percent of all mortgage borrowers, suggesting that the serious delinquency rate could rise to around 3.8 percent, up from 0.9 percent at present and well above the pre-pandemic rate of about 1.3 percent. Of course, not all of these borrowers will slip into serious delinquency, especially those who entered forbearance with non-delinquent accounts, even though they aren’t currently making payments. And other borrowers may fall delinquent without having entered forbearance, particularly if house prices decline and/or the current economic recovery falters. Nonetheless, from where we are now, it seems improbable that the end of mortgage forbearance will be associated with more than 6 percent of mortgagors becoming 90 or more days delinquent, as occurred during the Great Recession.
Wrapping Up
Amid high rates of unemployment and other types of household distress, consumer delinquency rates have been low and declining as economic policies have targeted households at potential risk. Troubled borrowers have seen their credit reports protected from damage, while forbearance has delivered on payment flexibility and cash-flow relief to households and business owners who have been affected by the pandemic. Of course, these programs have come at a cost to mortgage investors and servicers, and they may have also made credit scores less informative. Nonetheless, their success at keeping borrowers out of delinquency stands in sharp contrast to the experience of the Great Recession—when ever-rising consumer delinquencies and foreclosures were both a driver of the financial crisis and then, in a vicious cycle, a consequence of the crisis, as housing prices dropped and almost 12 million Americans went into foreclosure. This time, foreclosures have all but stopped, put on hold as a measure of consumer relief through the CARES Act, and the negative impact of skipping mortgage payments has remained muted on credit reports. How borrowers who have taken advantage of forbearance in the past year recover will depend on many factors, as economic conditions and policy measures evolve.
 Andrew Haughwout is a senior vice president in the Federal Reserve Bank of New York’s Research and Statistics Group.
 Donghoon Lee is an officer in the Bank’s Research and Statistics Group.
 Joelle Scally is a senior data strategist in the Bank’s Research and Statistics Group.
 Wilbert van der Klaauw is a senior vice president in the Bank’s Research and Statistics Group.
How to cite this post:
Andrew F. Haughwout, Donghoon Lee, Joelle Scally, and Wilbert van der Klaauw, “What’s Next for Forborne Borrowers?,” Federal Reserve Bank of New York Liberty Street Economics, May, 19, 2021, https://libertystreeteconomics.newyorkfed.org/2021/05/whats-next-for-forborne-borrowers.html
Additional Posts in This Series
Keeping Borrowers Current in a Pandemic
What Happens during Mortgage Forbearance?
Small Business Owners Turn to Personal Credit
Press Briefing
Disclaimer
The views expressed in this post are those of the authors and do not necessarily reflect the position of the Federal Reserve Bank of New York or the Federal Reserve System. Any errors or omissions are the responsibility of the authors.


 RSS Feed
 Follow Liberty Street Economics