Spending on goods and services that were constrained during the pandemic is expected to grow at a fast pace as the economy reopens. In this post, we look at detailed spending data to track which consumption categories were the most constrained by the pandemic due to social distancing. We find that, in 2019, high-income households typically spent relatively more on these pandemic-constrained goods and services. Our findings suggest that these consumers may have strongly reduced consumption during the pandemic and will likely play a crucial role in unleashing pent-up demand when pandemic restrictions ease.
Exploring Patterns of In-Person and Online Consumer Spending
Our analysis relies on credit and debit card transaction data from Commerce Signals, a Verisk Analytics business, which consists of a panel of around 40 million U.S. households. Importantly, the aggregation of these data aligns well with national retail sales numbers.
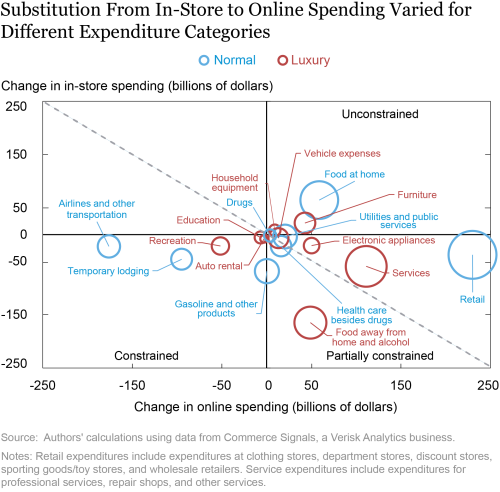
We start by calculating a “pandemic-constrained” index for each category of expenditures, bounded between 0 and 1. Although consumption may have fallen for various reasons, including changes in household income, we aim to rank different spending categories mainly by the extent to which they were constrained by social distancing. Therefore, using data from Commerce Signals, we look at how in-person and online spending performed for each expenditure category in 2020 relative to 2019. The next chart shows such performance. In order to show the relative importance of each spending category in a typical consumption basket, the size of each circle in the chart below is scaled to the category’s share of annual expenditures in Commerce Signals data for 2019. We also depict in red the categories that can be considered luxury goods: goods for which the share of expenditures rises as income rises. To do so, we employ the estimated Engel curves from Aguiar and Bils (2015), and classify goods with elasticities above one as luxuries. We return to the luxury good distinction when discussing spending patterns by household income.
Some categories experienced a drop in online spending as well as in in-person spending, as shown in the lower-left quadrant of the chart. We regard these categories, such as airlines, recreation, and temporary lodging, as particularly constrained by the pandemic. Indeed, consumption of these services generally necessitates a large degree of social interaction. At the other extreme, some consumption categories experienced increases in both in-store and online spending (categories in the upper-right quadrant), such as food at home. We therefore regard these categories as unconstrained by the pandemic.
The remaining categories, in the lower-right quadrant, experienced either full or partial substitution from in-person to online purchases. For categories such as food away from home, substitution toward online purchases was not large enough to offset the in-person drop due to social distancing efforts. In other cases, instead, the increase in online spending more than made up for the decline in in-person expenditures—this is what happened to retail spending, which includes expenditures at clothing and department stores.
In order to gauge the intensity of this substitution, we compute the ratio between the change in online spending and the absolute change in in-person expenditures. Higher values denote a higher degree of substitutability, thus suggesting that such categories were less constrained by social distancing efforts; lower values correspond to categories that were more constrained. We re-normalize our index such that it assigns a value of 0 to all the “unconstrained” categories, and a continuous value between 0 and 1 to the remaining categories, depending on their ability to substitute to online spending as described above.
Our index indicates that airline spending is the most pandemic-constrained category. Thanks to the ability to substitute toward online spending, retail (clothing, department stores) and electronic appliances were less constrained than food away from home according to our index, but more constrained than spending on furniture. Not surprisingly, we also find that our index is very negatively correlated with the change in total spending between 2019 and 2020. Such correlation is not perfect because consumption may have fallen for other reasons besides social distancing, such as changes in household incomes.
High-Income Households Typically Consume More Pandemic-Constrained Goods and Services
We then investigate typical spending by income groups. To do so, we employ data from the Consumer Expenditure Survey (CEX), an annual survey administered by the Bureau of Labor Statistics that provides data on household expenditures, income, and demographics. We merge 2019 CEX expenditure shares by different income groups with our index from Commerce Signals. We then construct an exposure measure for each income group by taking an expenditure-share weighted average of our pandemic-constrained index. Households that typically spend more on airlines will be more exposed than those that typically consume food away from home, and even more than those that typically consume food at home.
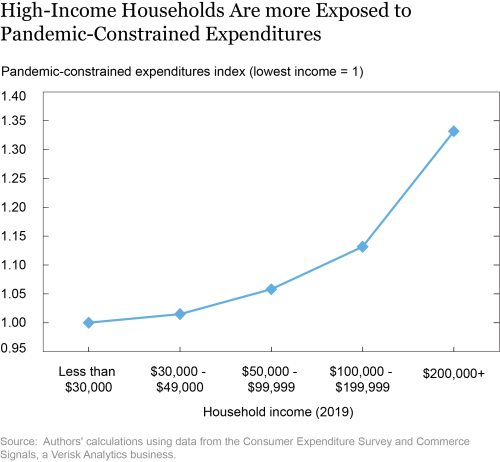
The chart below shows the differential exposure to pandemic-constrained expenditures by household income. Since we are interested in differences by household income, we have expressed our results relative to the lowest-income bracket, such that the latter takes a value of 1. For example, the exposure to pandemic-constrained expenditures for the highest-income bracket is 33 percent higher than for the lowest income bracket. According to our measure, higher-income households are therefore more likely to have had their consumption baskets affected because of the constraints that the pandemic and social distancing exerted on goods and services that they typically consume. Moreover, since high-income households account for a disproportionate share of aggregate consumption, such differential exposure will be important for understanding aggregate consumption dynamics moving forward.
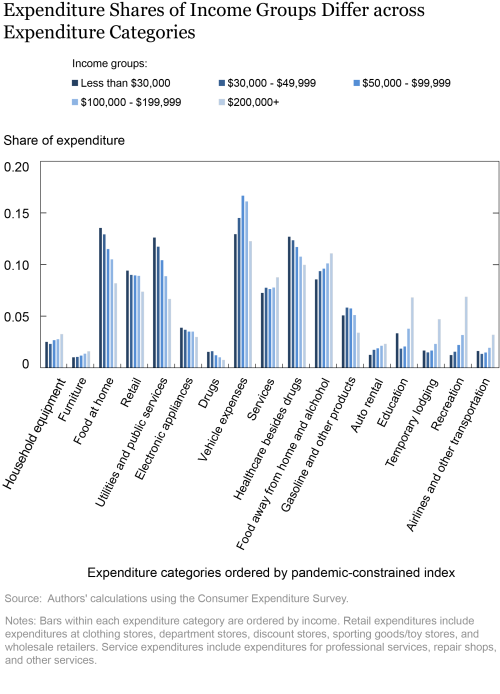
We next dig deeper into what drives this finding. In the following chart, we ordered categories from left to right according to our pandemic-constrained index. We show, for each income category, what share each spending category contributes to total expenditures.
The chart above shows significant heterogeneity in expenditure shares across expenditure categories by income. The relative importance of food at home, which according to our index was among the unconstrained categories, is clearly decreasing with income. The opposite, instead, is true for the most constrained categories, such as airlines, recreation, and temporary lodging, as shown in the right of the chart. Patterns are more mixed for other categories. Food away from home, which was partly constrained given the imperfect ability to substitute toward online purchases (for example, food delivery), plays a more prominent role for higher income households, but the opposite is true for health care, similarly ranked by our index.
Such patterns make the relationship between pandemic-constrained expenditures and income more nuanced. Similarly, as previously shown in our first chart, not all pandemic-constrained expenditures can be defined as luxury goods.
High-Income Households are Likely to Drive the Recovery in Pandemic-Constrained Consumption
Our findings have three main implications. First, the fact that high-income households had 2019 consumption baskets that were more exposed to pandemic-constrained expenditures suggests that they might have cut their consumption more sharply and persistently during 2020. Indeed, this is consistent with findings in a companion post, which shows that spending in high-income counties has contracted more substantially than in low-income counties and has also recovered more slowly.
Second, since high-income households are not only likely to have cut consumption the most, but also to have experienced relatively fewer labor income losses, it is likely that so-called excess savings are predominantly held by high-income households.
Third, to the extent that our exposure measure captures the potential for pent-up demand, we expect high-income households to drive an important part of the recovery in aggregate consumption going forward, through a resumption in pandemic-constrained expenditures. Whether household spending and expenditure shares across categories will revert to their pre-pandemic levels, and at what speed, remains an open question which crucially depends on the dynamics of excess savings, as discussed in a recent Liberty Street Economics post.
 David Dam is a senior research analyst in the Federal Reserve Bank of New York’s Research and Statistics Group.
 Davide Melcangi is an economist in the Bank’s Research and Statistics Group.
 Laura Pilossoph is an economist in the Bank’s Research and Statistics Group.
 Will Schirmer is a senior research analyst in the Bank’s Research and Statistics Group.
How to cite this post:
David Dam, Davide Melcangi, Laura Pilossoph, and Will Schirmer, “Who’s Ready to Spend? Constrained Consumption Across the Income Distribution,” Federal Reserve Bank of New York Liberty Street Economics, May 13, 2021, https://libertystreeteconomics.newyorkfed.org/2021/05/whos-ready-to-spend-constrained-consumption-across-the-income-distribution.html.
Related Reading
Racial and Income Gaps in Consumer Spending following COVID-19 (May 2021)
“Excess Savings” Are Not Excessive (April 2021)
Which Workers Bear the Burden of Social Distancing Policies (May 2020)
Disclaimer
The views expressed in this post are those of the authors and do not necessarily reflect the position of the Federal Reserve Bank of New York or the Federal Reserve System. Any errors or omissions are the responsibility of the authors.


 RSS Feed
 Follow Liberty Street Economics