


Supply chain disruptions have become a major challenge for the global economy since the start of the COVID-19 pandemic. Factory shutdowns (particularly in Asia) and widespread lockdowns and mobility restrictions have resulted in disruptions across logistics networks, increases in shipping costs, and longer delivery times. Several measures have been used to gauge these disruptions, although those measures tend to focus on selected dimensions of global supply chains. In this post, we propose a new gauge, the Global Supply Chain Pressure Index (GSCPI), which integrates a number of commonly used metrics with an aim to provide a more comprehensive summary of potential disruptions affecting global supply chains.
Measures of Supply Chain Developments
Several approaches have been used to assess supply chain problems. Such issues may arise within countries–pile-ups at ports or a shortage of truck drivers, for example—or they may spill across countries—as with a shortage of containers. Our proposed measure is therefore built on variables that are meant to capture factors that put pressure on the global supply chain, both domestically and internationally.
The first set of indicators we draw from focus on cross-border transportation costs. First, we use data on the Baltic Dry Index (BDI), which tracks the cost of shipping raw materials, such as coal or steel. Second, we exploit the Harpex index, which tracks container shipping rate changes in the charter market for eight classes of all-container ships. Finally, the U.S. Bureau of Labor Statistics (BLS) constructs price indices that measure the cost of air transportation of freight to and from the U.S., and we use the outbound and inbound airfreight price indices for air transport to and from Asia and Europe.
We show our measures of transportation costs in the two charts below. In the first chart, we notice that both shipping cost indices have witnessed enormous growth since the beginning of the global recovery from the troughs of the COVID-19 pandemic, although the BDI has begun to slow in recent months. It is interesting to note that the Harpex measure increased considerably more than it did during the recovery from the Global Financial Crisis (GFC), while the rise of the BDI has been on par with that of the GFC period. The second chart below plots the inbound and outbound costs of airfreight for the U.S. and Asia and for the U.S. and Europe. Airfreight costs from Asia and Europe to the U.S. accelerated especially sharply in 2020, as airlines dramatically cut airfreight capacity in response to the pandemic.
Growth of Container Shipping Rates Has Fallen in Recent Months
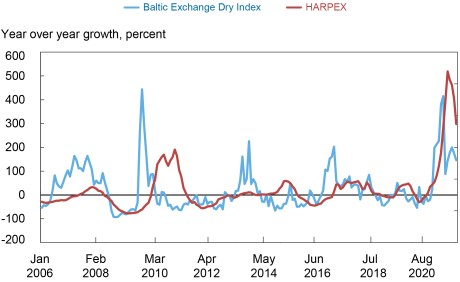
Sources: Harper Petersen Holding GmbH; Baltic Exchange; Bloomberg L.P.; Haver Analytics.
Air Freight Prices Reached Historic Highs during the Pandemic
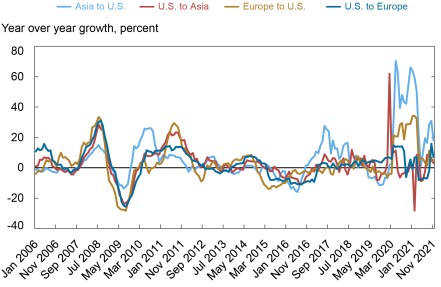
Sources: Bureau of Labor Statistics; Bloomberg L.P.
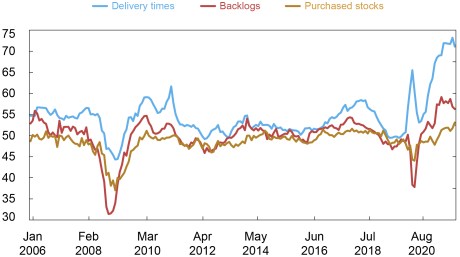
The second set of indicators rely on country-level manufacturing data from the Purchase Manager Index (PMI) surveys. In terms of country coverage, we focus on economies that have both a significant sample length and are substantially interlinked through global supply chains: the euro area, China, Japan, South Korea, Taiwan, the U.K., and the U.S. Note that in case of the U.S., the PMI data start only in 2007, so we combine the PMI data with those from the manufacturing survey of the Institute for Supply Management (ISM). From these PMI surveys, we use the following subcomponents of the country-specific manufacturing PMIs: “delivery time,” which captures the extent to which supply chain delays in the economy impact producers—a variable that may be viewed as identifying a purely supply-side constraint; ”backlogs,” which quantifies the volume of orders that firms have received but have yet to either start working on or complete; and, finally, ”purchased stocks,” which measures the extent of inventory accumulation by firms in the economy.
In the chart below, we plot GDP-weighted averages of the subcomponents of our countries’ manufacturing PMIs. The measures of supply bottlenecks have risen dramatically during the recent recovery period, and this rise has been most notable for the “delivery time” subcomponent of the PMIs across our seven economies.
PMI Subcomponents Have Diverged Substantially from Average Levels in Recent Months
Sources: Harper Petersen Holding GmbH; Baltic Exchange; Bloomberg L.P.; Haver Analytics.
Notes: Each subcomponent is constructed by aggregating subcomponents for the U.S., the U.K., the Euro Area, China, Taiwan, South Korea, and Japan via GDP weights. The “delivery times” PMI subcomponent has been inverted such that readings above 50 indicate longer delivery times.
The Global Supply Chain Pressure Index
The previously discussed variables contain valuable information regarding the state of supply chains across the different regions. However, each measure highlights different dimensions of potential disruptions in global supply chains. Furthermore, the emergence of global supply chains allowed industries across countries to become more interconnected, with air and maritime freight transportation facilitating this interconnectedness. For example, final products produced by U.S. firms are frequently assembled from components and parts manufactured in Asia and Europe. For these reasons, we will construct a supply chain pressure measure that combines data on country-specific supply chain measures with the aforementioned global measures of transportation costs.
Movements in the country-specific PMI components as well as in the transportation cost series can be due to either changes in demand or supply factors. To better isolate the supply-side drivers of each data series, we use additional information available from the PMI surveys for our set of seven economies. More specifically, we collect data on the “new orders” PMI subcomponent, which captures the extent of customer demand for firms’ products and regress the three country-specific supply chain PMI measures (delivery time, backlogs, and purchased stocks) on the contemporaneous value and two lags of this new orders component in an attempt to purge demand factors from these three supply chain PMI subcomponents. The residuals from these regressions for each country will then be used as inputs in constructing our global supply chain pressure index. Regarding the transport cost variables, we use both a GDP-weighted average of the aforementioned “new orders” PMI subcomponents as well as a similarly weighted average of the “quantities purchased” PMI subcomponents for our seven economies. The latter captures the extent of firms’ demand for intermediate inputs (both domestic and foreign), to proxy for producers’ input demand. In a similar vein as for the country-specific supply chain measures, we use regressions based on these two GDP-weighted demand proxies and their lags to cleanse our six global transport cost measures as much as possible from demand effects.
To estimate our GSCPI measure, we thus have available a data set of twenty-seven variables: the three country-specific supply chain variables for each of the economies in our sample (the euro area, China, Japan, South Korea, Taiwan, the U.K., and the U.S.), the two global shipping rates, and the four price indices summarizing airfreight costs between the U.S., Asia, and Europe. All these variables are corrected for demand effects to the greatest possible extent, as described previously. This data set is made up of monthly time series of uneven length: the advanced economies’ supply chain variables all start in 1997, for Japan they start in 2001 and for the other Asian economies 2004, the Harpex index starts in 2001, the BDI goes back to 1985 and the BLS airfreight price indices go back to 2005 on a monthly frequency and are quarterly from 2005 to 1997. Our aim is to estimate a common, or “global,” component from these time series. To be able to do that while also dealing with data gaps, we follow Stock and Watson (2002) and extract this common component for the 1997-2021 period through a principal component analysis while simultaneously filling the data gaps using this estimated common component.
The chart below presents the evolution of the resulting Global Supply Chain Pressure Index (GSCPI) on a monthly basis since 1997. The index is normalized such that a zero indicates that the index is at its average value with positive values representing how many standard deviations the index is above this average value (and negative values representing the opposite).
Global Supply Chain Pressures Remain High but May Have Begun to Moderate
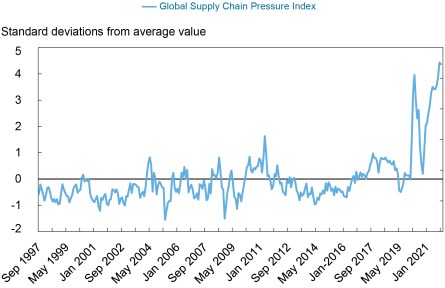
Sources: Bureau of Labor Statistics; Harper Petersen Holding GmbH; Baltic Exchange; IHS Markit; Institute for Supply Management; Haver Analytics; Bloomberg L.P.; authors’ calculations.
Note: Index scaled by its standard deviation.
The GSCPI oscillates over time, with several episodes that are noteworthy. We note a fall and then a rebound in the index during the GFC. While our empirical methodology attempts to purge demand factors before constructing the GSCPI, it is not a perfect measure and its dynamics during the GFC likely still capture some demand components. The GFC-period variation in the index is not as large as the moves seen in later periods, which arguably capture stronger supply-side factors. In 2011, we see a substantial rise in the index, attributable to two natural disasters. The first is the Tōhoku earthquake and resulting tsunami, which had an impact on both Japanese and foreign production, given that the affected regions were a center for automobile manufacturing. The second event involved flooding in Thailand, which inundated seven of the country’s largest industrial estates, affecting the global production chains of the auto and electronics industries. The index rises again during the China-U.S. trade disputes of 2017-18, as firms had to adjust their global procurement strategies.
The spikes in the GSCPI associated with the aforementioned events pale in comparison to what has been observed since the COVID-19 pandemic began. First, we observe that the GSCPI jumps at the beginning of the pandemic period, when China imposed lockdown measures. The index then fell briefly as world production started to get back online around the summer of 2020, before rising at a dramatic pace during the winter of 2020 (with COVID resurgent) and the subsequent recovery period. More recently, the GSCPI seems to suggest that global supply chain pressures, while still historically high, have peaked and might start to moderate somewhat going forward.
Conclusions
Our goal in constructing the GSCPI was to construct a parsimonious measure of global supply chain pressures that could be used to gauge the importance of supply constraints with respect to economic outcomes. In a follow-up post, we will quantify the impact of shocks to the GSCPI on recent movements in producer and consumer price inflation.

Gianluca Benigno is an assistant vice president in the Federal Reserve Bank of New York’s Research and Statistics Group.

Julian di Giovanni is an assistant vice president in the Bank’s Research and Statistics Group.

Jan J. J. Groen is an officer in the Bank’s Research and Statistics Group.

Adam I. Noble is a senior research analyst in the Bank’s Research and Statistics Group.
How to cite:
Gianluca Benigno, Julian di Giovanni, Jan J. J. Groen, and Adam I. Noble, “A New Barometer of Global Supply Chain Pressures” Federal Reserve Bank of New York Liberty Street Economics, January 4, 2022, https://libertystreeteconomics.newyorkfed.org/2022/01/a-new-barometer-of-global-supply-chain-pressures/.
Disclaimer
The views expressed in this post are those of the authors and do not necessarily reflect the position of the Federal Reserve Bank of New York, the Federal Reserve Board, or the Federal Reserve System. Any errors or omissions are the responsibility of the authors.
 RSS Feed
 Follow Liberty Street Economics
Following this, definitely an interesting barometer!
Edward,
Although it may be difficult to see following the large swings of the GSCPI over the past two years, it declined slightly to 4.37 in November from October’s level of 4.43. See also the downloadable data available from the link at end of this post.
RE: UPDATES TO GSCPI DATA
We have made the data used in our analysis available through a link at the bottom of the post. Also, we are currently working on a procedure to update and publish the GSCPI on a regular basis. We will share more updates when available.
Ryan,
As in SW02 the underlying common factor is approximated by means of principal components analysis and as such normally distributed error distributions are not explicitly used in the estimation of the common factor. It is true that the theoretical framework that justifies the use of principal components assumes Gaussian innovations, but even if innovations are non-Gaussian principal components still provides an expression of the population linear prediction of the common component. Also, the freight price data is combined with PMI data and as such heavy tailed type moves in individual series (especially the BDI) are potentially diluted. This seems to be the case as the loading on the BDI in the GSCPI is the smallest and about 15 times smaller than the loadings on the delivery times series. Finally, from the GSCPI chart it is clear that larger than 1 standard deviation events were very rare pre-2020, which suggests that 2-3 standard deviation events are not really that more regular than assumed under Gaussian distributions, at least pre-2020.
This is great information-I have been in SCM for > 50 years in both the carrier and shipper areas and teach SCM Full time now and this is valuable data to share with students
Looks like an interesting indicator. Is there an online dashboard where the GSCPI graph can be accessed and viewed monthly (assuming the data is updated monthly)?
Team, thank you. I have been searching for ways to measure supply chain pressures, basically just reading any article mentioning BOTTLENECK, which always felt very disjointed. The GSCPI is just what I needed. What is the easiest way to stay on top of GSCPI releases? Do I need to monitor the blog at the beginning of every month, or do you have a release schedule?
Regards, Scott Kellner
How often will you publish/update this index?
Is there a link anywhere on the New York Fed website where I can continue to follow us indicator?
Interesting dataset. One question – many of the components appear to have already peaked while the new aggregate index output appears to be at new highs. Any ideas on why that would be or how to interpret?
I dont see any “moderation” in your supply chain chart — if anything, it is getting worse, plus the recent Omicron variables have not yet fully manifested themselves in the data yet.
Are you planning to keep updating the series regularly? If so, by which approximate date?
Well done an nicely constructed piece of analysis. My question is specific to the freight price components (BDI, Harpex, BLS Air Freight).
Often in the maritime segment, we find that that price surges (or declines) are mostly event driven. Specifically we find heavy-tails in historical distributions and as such required 1/2 levels of integrating before analysis.
In this context, and understanding SW ’02; are there potential risks associated with the use of normal distribution on the model? Specifically is there a “take-away” risk where say a 2-3 stdev is more “regular” than one may perceive under otherwise normal assumptions?
Thanks
When do you expect to make the GSCPI time series data available?