
The Chinese government has followed a “zero covid strategy” (ZCS) ever since the world’s first COVID-19 lockdowns ended in China around late March and early April of 2020. While this strategy has been effective at maintaining low infection levels and robust manufacturing and export activity, its viability is being severely strained by the spread of increasingly infectious coronavirus variants. As a result, there now appears to be a fundamental incompatibility between the ZCS and the government’s economic growth objectives.
Measuring the Severity of Pandemic Restrictions in China
China’s ZCS is described in official statements as being “dynamic,” with local officials having the flexibility to strengthen and loosen restrictions within their jurisdictions depending on local conditions. For example, in conjunction with widescale testing, contact tracing, and quarantining, pandemic “lockdown” restrictions have typically been applied in a targeted manner to districts within cities, residential neighborhoods within districts, or even individual buildings within communities. On occasion, outbreaks have been severe enough to warrant large-scale restrictions encompassing entire cities or provinces. However, these large-scale containment schemes have been the exception to the norm, and the majority of restrictions in China have been relatively localized and generate few international headlines.
This localized approach to the ZCS makes it difficult to characterize the true severity of national restrictions at any point in time. In this post, we utilize a measure of restrictiveness that we calculate from a data set of intercity highway traffic from AutoNavi (also known as Gaode), a popular Chinese GPS mapping and navigation service. This data set contains daily data for 120 cities that reflect the number of trips between various pairs of cities. We treat this data as a social network where nodes and weighted edges are represented by cities and daily index values, respectively. We then calculate daily total weighted indices of “connectedness” for each city. Individual cities can then be examined individually or averaged into geographic or nationwide aggregates. The intuition behind the resulting indices is that they will fall sharply when a city or its major travel partner cities experience increases in pandemic restrictions. In theory, the index could even fall to zero under a complete lockdown.
The charts below plot the result of this measure. The upper panel shows the daily indices for Wuhan, the first city in the world to be put under lockdown on January 23, 2020, Shanghai, which has made world headlines for being put under a severe lockdown in March, and the nation as a whole. The panel clearly shows the severity of the lockdown at the beginning of the pandemic and confirms the severity of the latest lockdown in Shanghai, with the index dropping to levels even lower than those seen in Wuhan in early 2020.
Intercity Mobility Index Shows Widespread Pandemic Restrictions
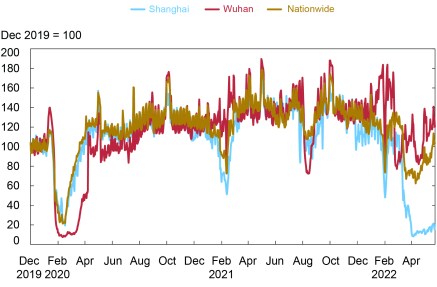
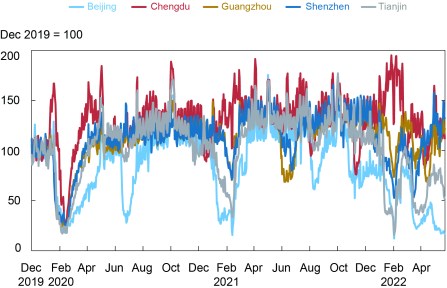
Importantly, the upper panel also shows that the nation as a whole has recently experienced the most elevated level of pandemic restrictiveness since early 2020. In fact, when we look at the five largest Chinese cities by population after Shanghai in the lower panel, we see that Shanghai is far from alone in having a depressed level of mobility. Beijing and Tianjin also show depressed mobility readings, and the other cities have notable downward movement during January and March as well. Another takeaway from this chart is that China as a whole has witnessed several earlier episodes of significant pandemic restrictions in the post-2020 period, reflecting waves of new coronavirus variants in the winter and summer/fall periods of 2021.
The chart below shows that the nationwide index is correlated with total nationwide COVID-19 cases. Such a result might not seem surprising in the context of most other countries where COVID-19 case numbers have been very high and national governments have imposed blanket policies. However, total cases in China have generally been in the low hundreds at most— several orders of magnitude below the numbers in many other less populated countries—and for nearly the entire pandemic only a handful of provinces at any given time have even recorded more than ten cases per day. Against this backdrop, it appears that the intercity travel index does a good job of detecting the effects of rolling “dynamic” local restrictions, even when they do not make news headlines.
Travel Restrictions Track COVID-19 Cases
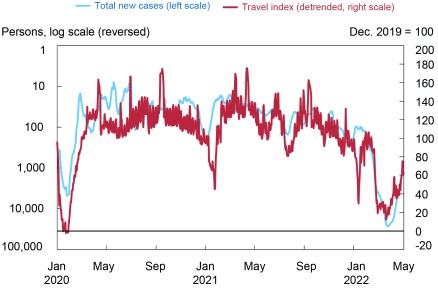
Note: Total new cases (left scale) is a seven-day average.
The Economic Impact of Recent Restrictions Has Been Severe
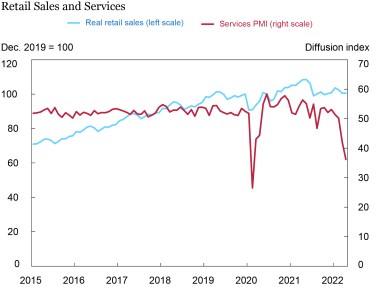
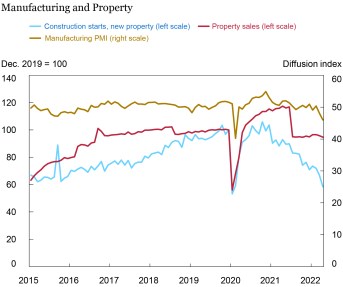
The economic impact of China’s ZCS became more noticeable with the emergence of the Delta variant in summer/fall 2021 but it only became severe under the Omicron wave that began at the end of 2021. The chart below plots seasonally adjusted levels of some important and widely followed economic indicators, namely real retail sales, the service and manufacturing sector purchasing manager indices, and sales and construction starts for new property.
Pandemic Restrictions Are Depressing Economic Activity
Note: Data are seasonally adjusted by author or source.
As is immediately clear, property has been under significant stress ever since the government announced strict financial controls on developers in summer 2020, with sales taking a large step downward following defaults by some major developers beginning about a year later. Pandemic restrictions have further depressed property activity. Retail sales and services show substantial and clear hits that are directly coincident with pandemic restrictions. Manufacturing activity has also taken a downward hit.
These impacts on economic activity will surely result in global spillovers through supply chains as well, though the jury is still out on just how significant spillovers will be. As noted in a recent blog post, the New York Fed’s Global Supply Chain Pressure Index began to show increased pressure in April, partly due to increases in China delivery times. At the same time, however, one may be cautiously optimistic that supply bottlenecks might not have as significant of a spillover when compared to 2020 and 2021. For example, firms and ports in China have become more adept at operating within “closed loop” frameworks, whereby workers live and work under strict quarantine conditions. Moreover, our intercity restriction indices for the geographic regions surrounding major Chinese ports suggest that travel restrictions have eased considerably in such areas, aside from Shanghai and Tianjin. Finally, in contrast to 2020 and 2021, inventory levels of the types of consumer goods that China produces appear to be better matched to sales demand.
Does Zero Covid Equate to Zero Growth?
China’s dynamic ZCS has arguably served it well for most of the pandemic. However, pandemic restrictions have now clearly set China’s economy on a growth trajectory that is well below the official target for this year of “about 5.5 percent.” Indeed, as of this writing, the current median forecast published by Bloomberg for 2022 growth is 4.5 percent, and nearly two-fifths of the forecasters in the Bloomberg panel expect growth to actually contract in the second quarter on a seasonally adjusted basis.
To judge the compatibility between zero covid and economic growth, it is useful to put China’s strategy in the context of viral evolution. China’s approach to managing the coronavirus was developed during the outbreak of the original wild-type viral strain. The strategy was sorely challenged by the coronavirus waves that hit China during the winter and summer/fall of 2021, respectively, with Delta being around two to three times as infectious as the original strain. Now Omicron and its several related variants have unleashed waves that are several times more infectious than Delta, putting COVID-19 among the most infectious of all respiratory viruses. Simply put, the Chinese leadership’s ability to control the spread of the coronavirus while maintaining a reasonable pace of economic growth appears to have hit its limit.
Against this backdrop, even though case numbers and travel restrictiveness are both improving again at present, a sustained easing of pandemic restrictions will likely be infeasible so long as the target effectively continues to be zero community transmission. Many major Chinese cities have reacted to Omicron by requiring mandatory COVID-19 tests for every resident every few days. These tests will inevitably result in positive cases, and even tiny outbreaks will lead to new sweeping lockdowns, based on recent precedent. Indeed, strict lockdowns triggered by small outbreaks will be the only way to avoid much larger outbreaks given the infectiousness of Omicron. To be sure, a relaxation of ZCS would result in large waves of cases, hospitalizations, and deaths given low natural immunity from infection, low uptake of boosters, and low levels of primary vaccination among the elderly in China. But, as long as these vulnerabilities are present and the authorities follow ZCS, Chinese policy makers in effect will be forced to prioritize zero covid over economic growth for the foreseeable future.

Hunter Clark is an international policy advisor in International Studies in the Federal Reserve Bank of New York’s Research and Statistics Group.

Lawrence Lin is a senior research analyst in the Bank’s Research and Statistics Group.
How to cite this post:
Hunter Clark and Lawrence Lin, “Does China’s Zero Covid Strategy Mean Zero Economic Growth?,” Federal Reserve Bank of New York Liberty Street Economics, June 2, 2022, https://libertystreeteconomics.newyorkfed.org/2022/06/does-chinas-zero-covid-strategy-mean-zero-economic-growth/
BibTeX: View |
Disclaimer
The views expressed in this post are those of the author(s) and do not necessarily reflect the position of the Federal Reserve Bank of New York or the Federal Reserve System. Any errors or omissions are the responsibility of the author(s).


 RSS Feed
 Follow Liberty Street Economics