


Supply chain disruptions continue to be a major challenge as the world economy recovers from the COVID-19 pandemic. Furthermore, recent developments related to geopolitics and the pandemic (particularly in China) could put further strains on global supply chains. In a January post, we first presented the Global Supply Chain Pressure Index (GSCPI), a parsimonious global measure designed to capture supply chain disruptions using a range of indicators. We revisited our index in March, and today we are launching the GSCPI as a standalone product, with new readings to be published each month. In this post, we review GSCPI readings through April 2022 and briefly discuss the drivers of recent moves in the index.
More Stress on Supply Chains
The chart below provides an update of the GSCPI through April; readers can find a link to the updated data series on our new product page. Between December 2021 and March 2022, the index registered an easing of global supply chain pressures, though they remained at very high levels historically. However, the April 2022 reading suggests a worsening of conditions as renewed strains emerge in global supply chains.
April Data Indicate Worsening of Supply Chain Pressures
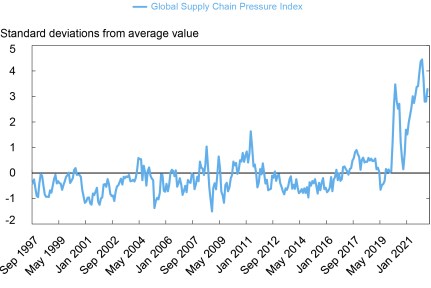
Note: Index is scaled by its standard deviation.
Methodology
Before analyzing this recent pickup in supply chain pressures, we remind readers that the GSCPI is based on two sets of data. Global transportation costs are measured by using data on ocean shipping costs, for we which we employ data from the Baltic Dry Index (BDI) and the Harpex index, as well as BLS airfreight cost indices for freight flights between Asia, Europe, and the United States. We also use supply chain-related components of Purchase Manager Index (PMI) surveys—“delivery times,” “backlogs,” and “purchased stocks”—for manufacturing firms across seven interconnected economies: China, the euro area, Japan, South Korea, Taiwan, the United Kingdom, and the United States. Before combining these data within the GSCPI by means of principal component analysis, we strip out demand effects from the underlying series by projecting the PMI supply chain components on the “new orders” components of the corresponding PMI surveys and, in a similar vein, projecting the global transportation cost measures onto GDP-weighted “new orders” and “inputs purchased” components across the seven PMI surveys.
Sources of Pressure
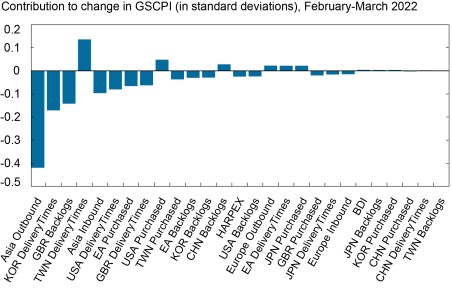
So, what are the drivers behind recent moves in the GSCPI? The charts below illustrate how each of the underlying variables contributed to the overall change in the GSCPI in the last two months. Each column represents the contribution, in standard deviations, of each component of our index to the overall change in the index during a given period. In the first chart, we examine February-March 2022. We note that the lessening of supply chain pressures over this period was widespread across the various components, which indicated a welcome reduction in global supply chain disruptions. Most of the series in our data set declined over this period; the U.K. “backlog” component worsened and the U.S. “purchased stocks” component increased marginally.
Widespread Improvements Seen across Components in March 2022
In the chart below, we focus on the contributions of the underlying components of the GSCPI from March to April 2022.
Global Supply Chain Pressures Worsen in April 2022
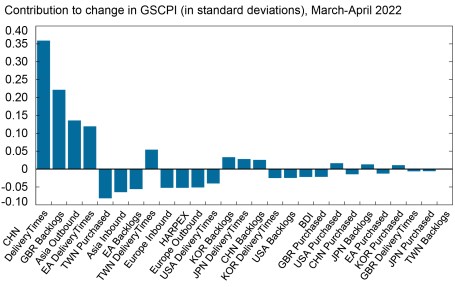
As the chart indicates, the worsening of global supply chain pressures in April was predominantly driven by the Chinese “delivery times” component, the increase in airfreight costs from the United States to Asia, and the euro area “delivery times” component, as other components have eased over the month. These developments could be associated with the stringent COVID-19-related lockdown measures adopted in China, as well as the consequences of the Ukraine-Russia conflict for supply chains in Europe.
Finally, as we noted in our previous post and discuss on our product page, recent GSCPI readings are subject to revision. The chart below compares the current GSCPI release with the previous three releases, showing that revisions can have an impact up to a year back in time. The chart indicates that, based on the current vintage of the GSCPI, the decrease in global supply chain pressures through April occurred at a slighter faster pace than previous GSCPI estimates had suggested.
Revised and Realized Data Can Alter Previous Supply Chain Pressure Readings
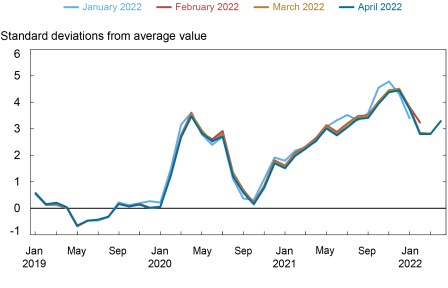
Note: Index is scaled by its standard deviation.
Conclusions
In this post, we provide an update of the GSCPI through April 2022. This estimate suggests that the moderation we have observed in recent months has been partially reversed, as lockdown measures in China and geopolitical developments are putting further strains on delivery times and transportation costs in China and the euro area. Forthcoming readings will be particularly interesting as we assess the potential for these developments to further heighten global supply chain pressures.

Gianluca Benigno is the head of International Studies in the Federal Reserve Bank of New York’s Research and Statistics Group.

Julian di Giovanni is head of Climate Risk Studies in the Bank’s Research and Statistics Group.

Jan J.J. Groen is an economic research advisor in the Bank’s Research and Statistics Group.

Adam Noble is a senior research analyst in the Bank’s Research and Statistics Group.
How to cite this post:
Gianluca Benigno, Julian Di Giovanni, Jan Groen, and Adam Noble, “Global Supply Chain Pressure Index: May 2022 Update,” Federal Reserve Bank of New York Liberty Street Economics, May 18, 2022, https://libertystreeteconomics.newyorkfed.org/2022/05/global-supply-chain-pressure-index-may-2022-update/.
Disclaimer
The views expressed in this post are those of the authors and do not necessarily reflect the position of the Federal Reserve Bank of New York or the Federal Reserve System. Any errors or omissions are the responsibility of the authors.
 RSS Feed
 Follow Liberty Street Economics
Very useful. Thank you.