


In a series of four posts, we review key elements of the Federal Reserve’s monetary policy implementation framework. The framework has changed markedly in the last two decades. Prior to the global financial crisis, the Fed used a system of scarce reserves and fine-tuned the supply of reserves to maintain rate control. However, since then, the Fed has operated in a floor system, where active management of the supply of reserves no longer plays a role in rate control, but rather the Fed’s administered rates influence the federal funds rate. In this first post, we discuss the salient features of the implementation framework in a stylized way.
Pre 2008, Reserve Scarcity
Before October 2008, the Federal Open Market Committee (FOMC) communicated the stance of monetary policy by announcing a target for the federal funds rate. The Fed would then use open market operations to make small adjustments to the supply of reserves so that the effective federal funds rate (EFFR) would print close to the target set by the FOMC. This type of implementation regime that relies on reserve scarcity is often referred to as a corridor system (as explained in this article). Under this framework, depository institutions, or banks, were incentivized to hold as few reserves as possible since they did not earn interest on their Fed account balances. Reserve balances that banks held in their Fed accounts added up to a very small amount, as can be seen in the next chart. The banking system operated with aggregate reserve scarcity and relied on the redistribution of reserves in an active interbank market.
Post 2008, Reserve Abundance
With the onset of the global financial crisis (GFC), the Fed introduced liquidity facilities and conducted large-scale asset purchases (LSAPs) to improve conditions in financial markets and stimulate the economy. Although these actions primarily influenced conditions through lending against and purchasing specific assets, they also added a substantial amount of reserves to the banking system. As shown in the chart below, at the beginning of 2009, reserves in the banking system exceeded $800 billion, compared to approximately $10 billion pre-crisis. Over subsequent years, the FOMC continued to conduct asset purchases to promote a stronger economic recovery and reserves continued to increase until late 2014.
Reserve Balances Have Seen Significant Expansion
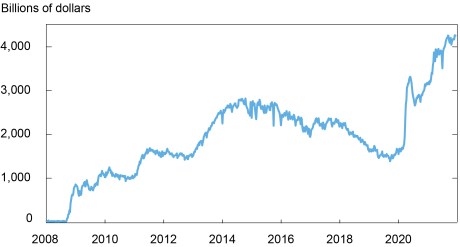
Source: Federal Reserve Economic Data (FRED).
With the significant expansion of reserves in the banking system, rate control was challenging to achieve through the previous corridor system because reserves were not scarce anymore (more details can be found in this report). Small changes in the supply of reserves no longer impacted the fed funds rate. Effective October 1, 2008, Congress gave the Fed a new tool that can help control the fed funds rate in such circumstances: the authority to pay banks interest on reserves. We will refer to this tool as interest on reserve balances (IORB) throughout the blog series, consistent with a recent rule change. As shown in the chart below that illustrates the banking system demand curve for reserves, at large quantities of reserves, the demand curve becomes flat around the IORB rate because it sets a floor below which banks should be unwilling to lend. In this new regime, the FOMC announces a target range for the fed funds rate, and the Fed uses IORB, together with other tools that we will discuss in upcoming posts, to maintain the EFFR (shown by the red circle in the chart) within the range. This type of implementation regime is often referred to as a floor system.
Banking System Reserve Demand Curve
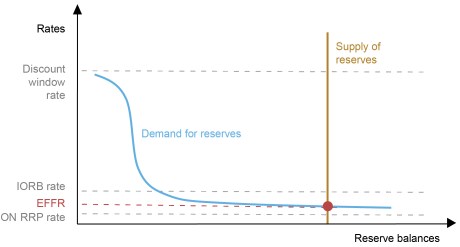
Notes: The discount window rate is the interest rate charged to depository institutions on loans they receive from the discount window facility. The overnight reverse repurchase agreement (ON RRP) rate is the maximum interest rate that the Federal Reserve is willing to pay at the ON RRP facility. IORB is interest on reserve balances. The effective federal funds rate (EFFR) is represented by the red circle, where the demand for reserves and the supply of reserves intersect.
Rate control through the floor system has proven to be very effective. The next chart shows the IORB rate and the EFFR between 2009 and 2021. Over that period, the EFFR remained close to the IORB rate, showing that with IORB (along with the assistance of other implementation tools), the Fed has been able to maintain its control of the fed funds rate even when reserves are not scarce. Moreover, as expected in floor systems, fluctuations in the supply of reserves did not lead to large swings in the fed funds rate. After a review of the experience, the FOMC announced that it would continue to implement monetary policy in the current framework.
The EFFR Has Remained Close to the IORB Rate
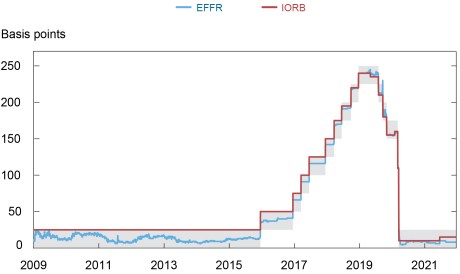
Sources: Federal Reserve Economic Data (FRED); authors’ calculations.
Notes: EFFR is effective federal funds rate. IORB is interest on reserve balances. The shaded area represents the Federal Open Market Committee target range for the federal funds rate. Month-end observations are dropped.
Benefits of the New Framework
A comprehensive review of costs and benefits of the new framework is beyond the scope of this post. In this section, we review the main benefits of implementing policy using the current framework.
First and foremost, as noted earlier, the framework has to date been very effective at maintaining rate control and has shown strong resilience to shifts both in the supply of and demand for reserves. In addition to the key role of IORB, other policy tools, such as overnight reverse repurchase agreement (ON RRP) operations, repurchase agreement operations, and technical adjustments to IORB and the ON RRP rates, have also played important roles. We discuss these tools in more detail in our next three posts.
Second, the current framework is robust to environments where the Fed needs to expand its balance sheet to address shocks or economic downturns, which has the effect of substantially increasing reserves in the banking system. This was a key benefit of the framework in 2008 and it proved valuable again in March 2020, when the financial system was buffeted by stress related to the coronavirus pandemic. In addition, this framework allows the Fed to use LSAPs to provide accommodation during zero lower bound periods without being concerned about the need to reestablish reserve scarcity before interest rates can be lifted.
Finally, another benefit worth mentioning is related to financial stability. The framework allows the Fed to supply more of the most liquid asset—reserves—to the banking system, making banks more resilient. Reserves are an important asset for banks to hold in their buffers of high-quality liquid assets, mandated by the Basel III regulations, to meet unexpected outflows and as elements of their resolution and risk management plans. Indeed, in contrast to other assets, reserves don’t need to be turned into cash, because they already are cash and can be used immediately to satisfy payment obligations (See this Liberty Street Economics post for more detail).
Summing Up and Looking Ahead
In this post, we described how the Fed’s monetary policy implementation framework changed from one that required reserve scarcity to control interest rates to one that relies primarily on administered rates. Our description of the current system was stylized and focused on banks’ reserve demand curve and authority to pay interest on reserve balances. However, the financial system in the United States is complex and banks represent only one segment of financial market activity. As such, the Fed uses additional tools to help support rate control in a system where non-bank institutions also affect the transmission of monetary policy. In the next three posts, we describe these tools in the context of the Fed’s floor system and discuss how adjustments to these tools maintain rate control.

Gara Afonso is an assistant vice president in the Federal Reserve Bank of New York’s Research and Statistics Group.

Lorie Logan is an executive vice president in the Bank’s Markets Group and manager of the System Open Market Account for the Federal Open Market Committee.

Antoine Martin is a senior vice president in the Bank’s Research and Statistics Group.

William Riordan is an assistant vice president in the Bank’s Markets Group.

Patricia Zobel is a vice president in the Bank’s Markets Group and deputy manager of the System Open Market Account for the Federal Open Market Committee.
Disclaimer
The views expressed in this post are those of the authors and do not necessarily reflect the position of the Federal Reserve Bank of New York or the Federal Reserve System. Any errors or omissions are the responsibility of the authors.
 RSS Feed
 Follow Liberty Street Economics
Thanks for putting this together!