In this post, we discuss the climate-related risks faced by the Federal Reserve’s Second District and compare these with risks faced by the nation as a whole. The comparison helps contextualize the risks while framing them in the broader context of a changing climate at the national level. We show that the continental Second District—an area consisting of New York State, the twelve northern-most counties of New Jersey, and Fairfield County in Connecticut—faces fewer and less severe climate-related physical risks than the nation as a whole. However, the areas that comprise the Second District still rank somewhat high in key risks that include “heat stress.” This holds true especially for New York City.
Distribution of Key Risks
There are several types of risks that may interest policymakers and academics who are focused on understanding a region’s exposure to physical risks. There are also a great many ways of quantifying and aggregating these risks. For simplicity and to facilitate replication, we make use of publicly available data from the Federal Emergency Management Agency (FEMA) national risk index (NRI) database. These data are easily sourced with transparent methodology and available at the census-tract level for the entire nation. Each type of disaster risk is given a risk rating and—more importantly—a clear risk score. The scores are a gauge of the degree to which a community will be adversely affected by an event after accounting for resiliency preparations that inhabitants and local governments have made. We make use of data obtained at the end of 2022, with scores reflecting possible disaster-type losses over the next few years.
We first analyze the aggregate risks faced by census tracts of the Second District—when compared with the nation as a whole—and conclude that the Second District faces low overall risks. In fact, the vast majority of Second District census tracts do not stand to suffer any significant disasters in a given year. By contrast, over a third of census tracts in the United States face moderate risk, being exposed to risk of damages between $1 and 2 million in any given year.
However, looking at aggregated risk values may obscure the fact that the Second District could face higher risks from certain types of disasters. The analysis may thus be inadvertently underrepresenting risk by averaging and aggregating different types. We therefore use FEMA’s risk scores and break this data down into individual risk types. We compare the distribution of different risks in the table below, finding that the mean risk scores for all natural hazards as an aggregate measure, heat waves, as well as both types of flooding (riverine and coastal), are lower in the Second District than the nation as a whole (we drop census tracts with missing risk scores for a particular type of risk). These differences are statistically significant, meaning the distribution of census-tract level risks would suggest that lower Second District risks are not the result of random chance. Moreover, we see that the 90th percentile of risks—which represents extreme events—is also significantly lower in the Second District than in the rest of the nation. This means that tail risks in some parts of the district are not obscured by low overall risks.
Extreme Risks in the Second District Are Lower Than in the Rest of the Nation
| Second District | United States | |||
| Mean | P90 | Mean | P90 | |
| Natural hazard risk | 11.3*** | 15.7 | 15.5 | 26.4 |
| Heat wave risk | 13.5*** | 24.2 | 12.8 | 28.9 |
| Riverine flood risk | 6.1*** | 17.5 | 8.2 | 20.7 |
| Coastline flood risk | 2.5* | 8.1 | 0.2 | 9.2 |
Notes: This table reports census-tract-level summary statistics for natural hazard risk for the Federal Reserve’s Second District (excluding the overseas territories of Puerto Rico and the U.S. Virgin Islands) and the United States. P90 indicates risks in the 90th percentile. Inland regions have no exposure to coastal flood risk. Stars indicate the p-value of the two-sided difference-in-means test between the Second District and nationwide values. *** indicate significance at the 1 percent level; * indicates significance at the 10 percent level.
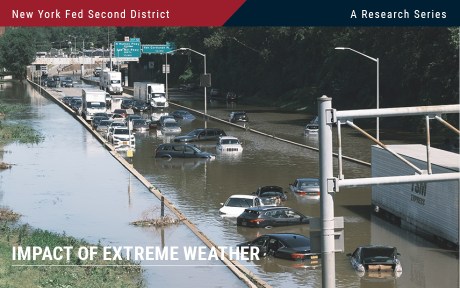
A residual source of concern may be the fact that some of the greater flooding risks for the Second District are concentrated in and around New York City and northern New Jersey. These are areas of both high population density and economic importance. However, while flooding risk is a justifiable concern, the risks faced by New York City (risk scores of 40 or less) are statistically far lower than those faced by other large urban centers/cities in the Southeast (which have risk scores of up to 90).
Ranking Risks across the Federal Reserve Districts
While the Second District does not face high risks when compared to the nation as a whole, this comparison may blur a number of different areas together. It is therefore worthwhile to consider how the Second District compares with other Federal Reserve Districts. (For reference, see this map of the twelve Federal Reserve districts.) After all, these areas usually comprise several geographically proximate states with similar risk profiles. As such, we can see whether the Second District is indeed less risky, or whether that conclusion is based on comparing the Second District with a number of geographically dissimilar areas at the national level. We rank each region by its mean exposure to aggregate natural hazard exposure, as well as tornado, heat wave, and a combined flooding risk (riverine and coastal) scores (see the table below).
The Second District (D-2) Ranks Much Lower in Aggregate Risk than the Riskiest District (D-12)
| Rank | Aggregate Risk Value | Tornado Risk | Heat Wave Risk | Flood Risk |
| 1 | D-12 | D-8 | D-8 | D-6 |
| 2 | D-6 | D-10 | D-7 | D-5 |
| 3 | D-11 | D-11 | D-11 | D-1 |
| 4 | D-8 | D-7 | D-2 | D-11 |
| 5 | D-5 | D-9 | D-9 | D-8 |
| 6 | D-10 | D-6 | D-3 | D-3 |
| 7 | D-9 | D-4 | D-12 | D-2 |
| 8 | D-7 | D-5 | D-4 | D-4 |
| 9 | D-2 | D-3 | D-10 | D-10 |
| 10 | D-4 | D-2 | D-5 | D-7 |
| 11 | D-1 | D-1 | D-1 | D-9 |
| 12 | D-3 | D-12 | D-6 | D-12 |
Notes: This table ranks districts of the Federal Reserve System by their mean exposure to FEMA NRI risk scores in four categories. We collapse census-tract-level data, lumping together those census tracts that belong to a district. A map of the twelve Federal Reserve Districts is available here: https://www.federalreserve.gov/aboutthefed/federal-reserve-system.htm. District 1 is served by the Federal Reserve Bank of Boston, District 2 by the Federal Reserve Bank of New York, District 3 by the Federal Reserve Bank of Philadelphia, District 4 by the Federal Reserve Bank of Cleveland, District 5 by the Federal Reserve Bank of Richmond, District 6 by the Federal Reserve Bank of Atlanta, District 7 by the Federal Reserve Bank of Chicago, District by the Federal Reserve Bank of St. Louis, District 9 by the Federal Reserve Bank of Minneapolis, District 10 by the Federal Reserve Bank of Kansas City, District 11 by the Federal Reserve Bank of Dallas, and District 12 by the Federal Reserve Bank of San Francisco.
As can be seen in the table above, the Second District does not rank highly in aggregate risk exposure. The Twelfth District narrowly beats out other districts due to its high wildfire risk (encompassing, as it does, all western states). Tornado risk is concentrated in the country’s interior states, with the greatest risks between the Missouri and Mississippi rivers and in Texas. Similarly, flood risk is concentrated in the Fifth and Sixth Districts, which encompass the southeast of the United States. These observations follow expected patterns of risk exposure.
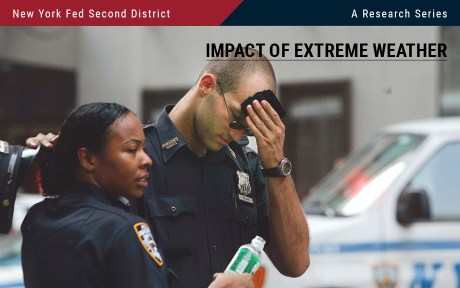
Solely the risk of heat waves stands out for the Second District. Though the district does not rank as the most exposed, this risk may nevertheless pose some concern for future policymakers. New York City ranks significantly higher for heat wave risk than the nation and the rest of the Second District. This may put people and businesses at risk. In fact, the effects of heat stress have already made themselves felt. Recall that in the summer of 2019, the New York City energy supplier Con Edison was forced to cut power to some homes in order to avoid a total collapse of the energy grid during a heat wave (see here). The discomfort from power outages felt by individuals may be compounded by issues of spoiled food at retailers on hot days—individual retailers may face losses between $30,000 (for smaller retailers) to $5,000,000 (for larger retailers) on each day without power. Finally, peak-load energy in the summer is provided by inefficient and polluting oil-fired generators around New York City, setting off a compounding cycle as worsening local air quality, especially in lower-income communities, forces households inside, where they must run ACs. The growing number of hot days will pose a continued challenge for New York City. Days classified as a heat wave—with temperatures above 90 degrees—could reach seventy-five a year by 2080 (see here). As such, heat wave risks, as well as flooding concerns in lower-lying areas, may well pose some concerns to policymakers—especially those of New York City and northern New Jersey.
Concluding Remarks
The Second District, while facing some climate physical risks, is not the most exposed region in the United States. Many other regions, such as the Southeast or the West, are far more exposed to particular disaster types, such as hurricanes, flooding, or fires. Even still, the Second District faces some flood and storm risk. By far the greatest risk for the district, however, is heat-related, with densely populated New York City facing significantly more heat-wave-related risks than the rest of the district and the United States. This exposure may concern policymakers going forward. Finally, physical risks are not the only concerns faced by policymakers; there are transition risks as well, as the Second District adapts its energy system to depending less on carbon, a topic the following blog in the series discusses.

Kristian Blickle is a financial research economist in Climate Risk Studies in the Federal Reserve Bank of New York’s Research and Statistics Group.

Rajashri Chakrabarti is the head of Equitable Growth Studies in the Federal Reserve Bank of New York’s Research and Statistics Group.

Maxim Pinkovskiy is an economic research advisor in Equitable Growth Studies in the Federal Reserve Bank of New York’s Research and Statistics Group.
How to cite this post:
Kristian Blickle, Rajashri Chakrabarti, and Maxim Pinkovskiy, “Comparing Physical Risk: The Fed’s Second District versus the Nation,” Federal Reserve Bank of New York Liberty Street Economics, November 8, 2023, https://libertystreeteconomics.newyorkfed.org/2023/11/comparing-physical-risk-the-feds-second-district-versus-the-nation/
BibTeX: View |
Disclaimer
The views expressed in this post are those of the author(s) and do not necessarily reflect the position of the Federal Reserve Bank of New York or the Federal Reserve System. Any errors or omissions are the responsibility of the author(s).


 RSS Feed
 Follow Liberty Street Economics