


An important part of the mission of the Federal Housing Administration (FHA) is to provide affordable mortgages that both promote the transition from renting to owning and create “sustainable” homeownership. The FHA has never defined what it means by sustainability. However, we developed a scorecard in 2018 that tracks the long-term outcomes of FHA first-time buyers (FTBs) and update it again in this post. The data show that from 2011 to 2016 roughly
21.8 percent of FHA FTBs failed to sustain their homeownership.
In December 2009, the FHA Commissioner David Stevens described the FHA’s mission as follows:
“As a mission-driven organization, FHA’s goal is to provide sustainable homeownership options for qualified borrowers.”
However, in the following fourteen years, the FHA never further articulated what it means by sustainable homeownership, nor has it proposed any metrics for tracking its progress against this important goal.
To promote affordable mortgages, the FHA provides default insurance to lenders against any credit losses. An important aim of the FHA is to foster the transition of households from renting to owning. Only then can the household begin to build home equity. However, the ultimate success of this home equity accumulation depends critically on the sustainability of homeownership.
The focus of the FHA on the transition from renting to owning can be seen by its very high share of mortgages for home purchases going to first-time buyers. We use the Federal Reserve Bank of New York’s Consumer Credit Panel (CCP) data to identify a FTB as a household taking on a mortgage when it has never previously had a mortgage on its credit file. Our first chart shows the annual breakdown of FHA purchase mortgages between FTBs and repeat buyers.
The Vast Majority of FHA Purchase Mortgages Go to FTBs
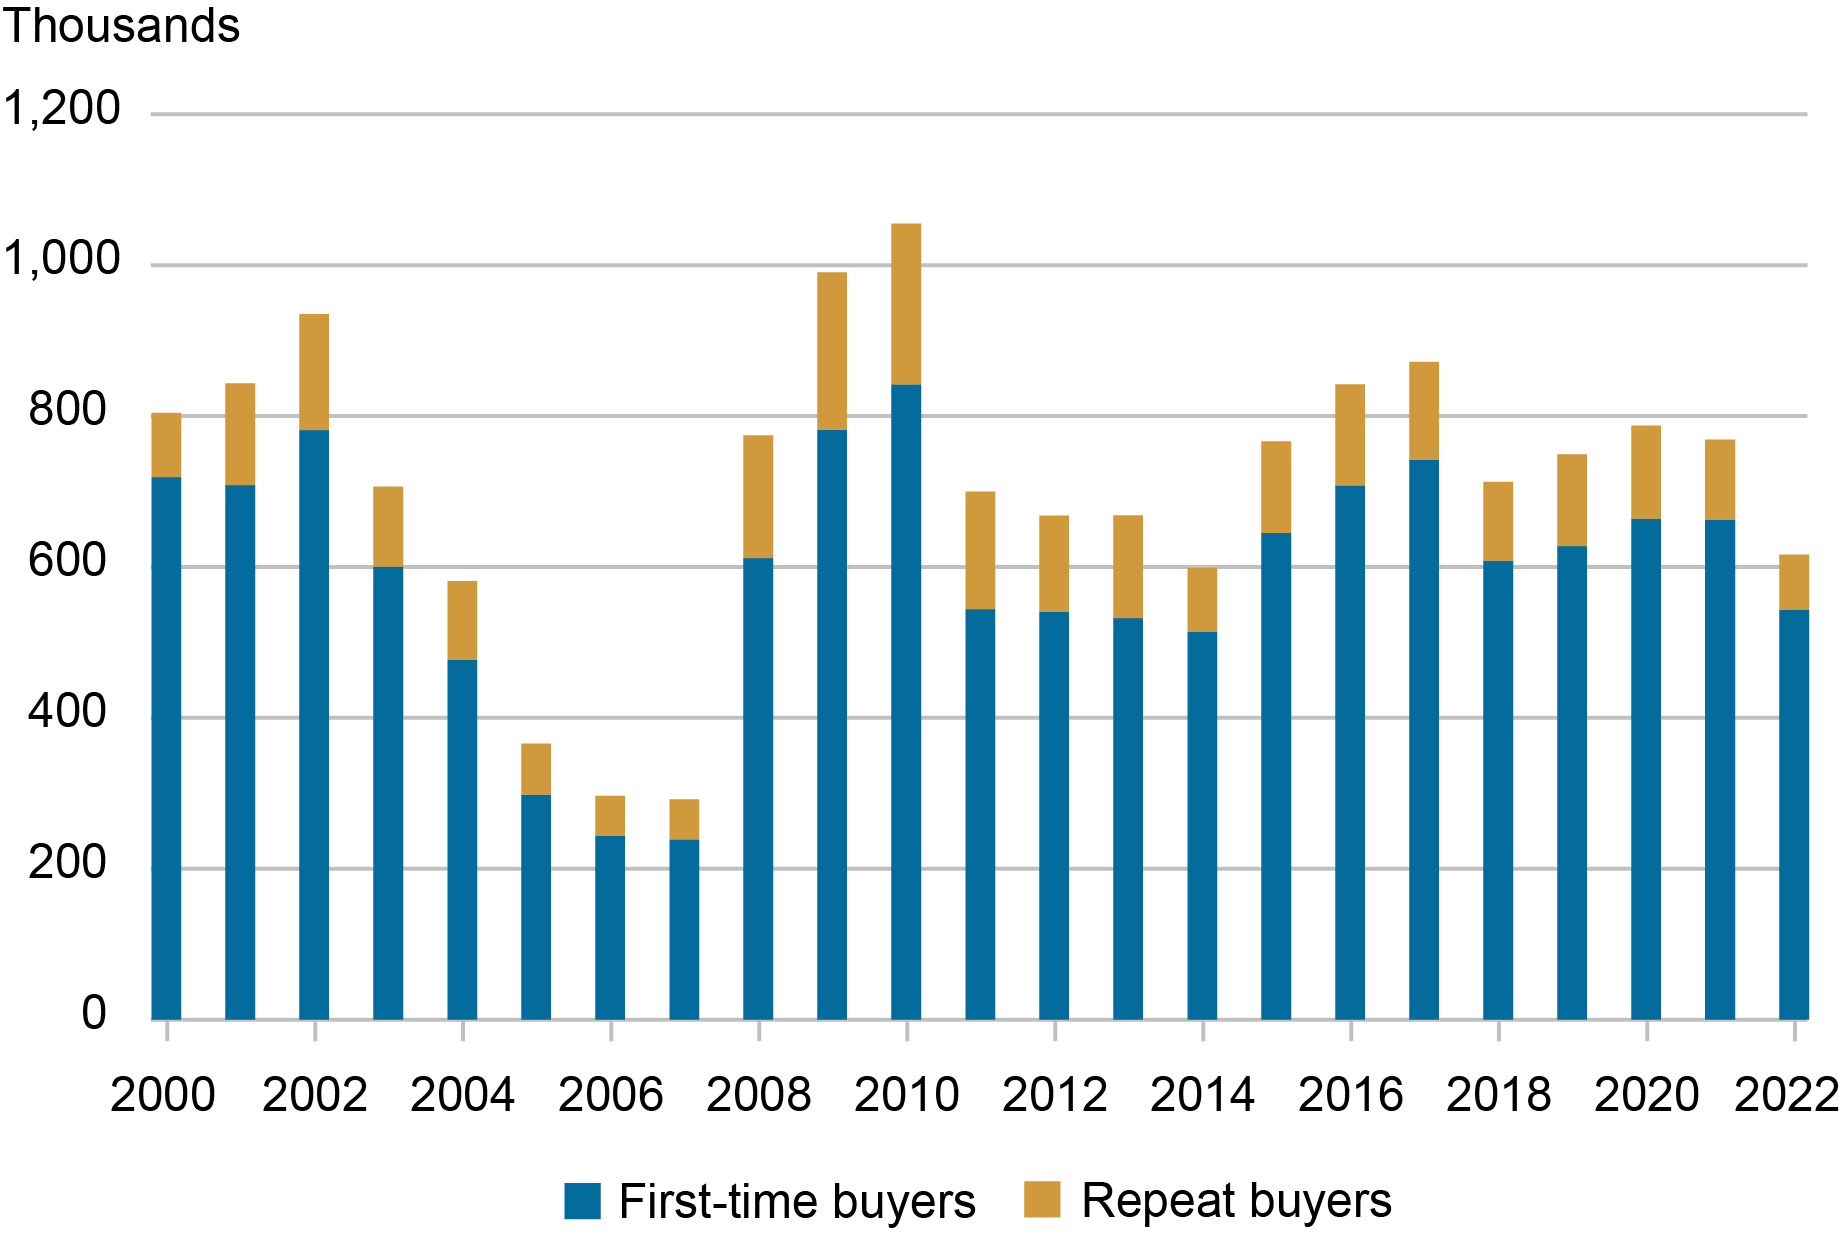
Sources: New York Fed Consumer Credit Panel/Equifax data; authors’ calculations.
Notes: FHA is Federal Housing Administration. FTB is first-time buyer.
From 2000-22, 83 percent of FHA purchase mortgages went to FTBs. This compares to 62 percent to FTBs for the Veterans Affairs (VA), 56 percent for the government-sponsored entities (GSEs) Fannie Mae and Freddie Mac, and 57 percent for all others.
How has the FHA done at targeting its credit guarantees to qualified borrowers? Most FHA FTBs make the minimum 3.5 percent downpayment. That is, they start their homeownership experience with very little home equity (or equivalently very high leverage—a debt to equity ratio over 27). This situation provides little cushion to absorb any house price declines. The next most important underwriting criteria for identifying qualified borrowers is their credit score.
The annual credit score distribution for FHA FTBs is shown in the chart below.
A High Share of FHA FTBs Have Weak Credit Scores
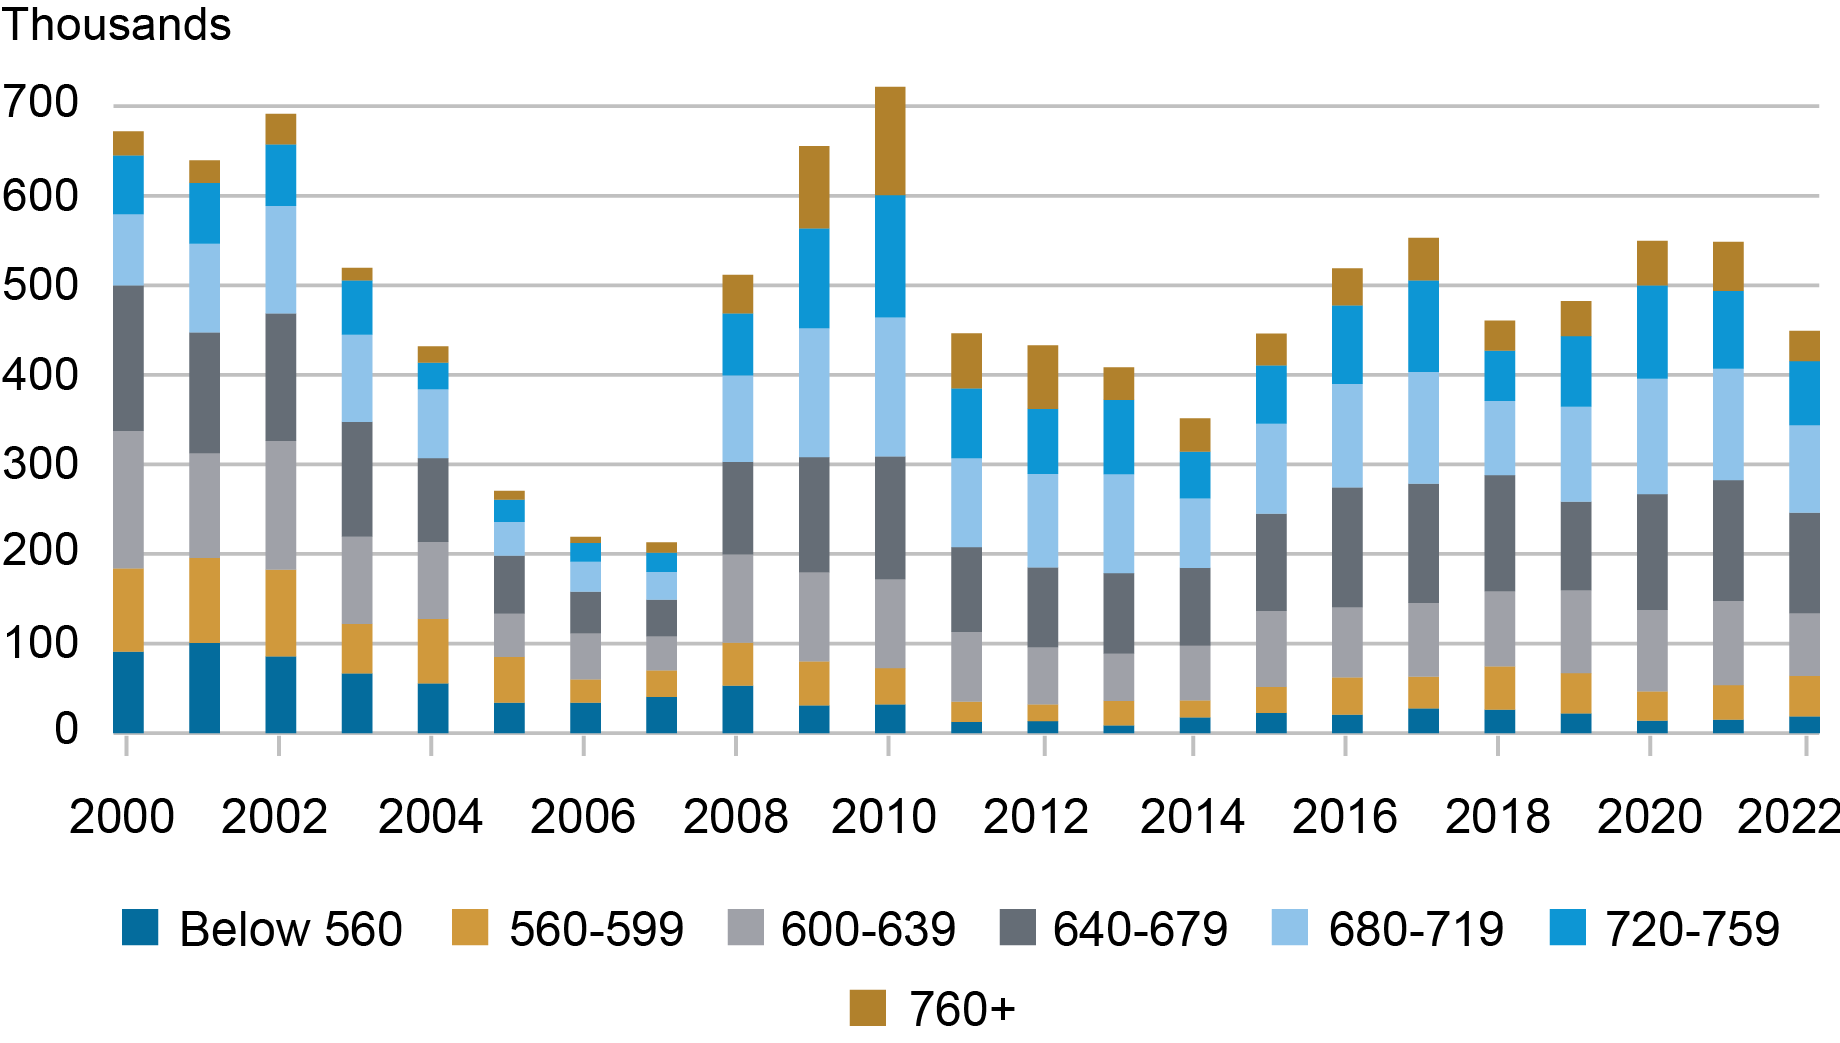
Sources: New York Fed Consumer Credit Panel/Equifax data; authors’ calculations.
Note: The buyer’s credit score equals the Equifax risk score.
In the early 2000s, the private-label security (PLS) market expanded and competed for market share, reducing the FHA’s volume of purchase mortgages to FTBs. Looking at the chart above, we can see that the PLS market attracted the relatively stronger credit borrowers away from the FHA. From 2001 to 2008, 70 percent of FHA FTBs had weak credit scores (that is, credit scores below 680). Following the financial crisis, the credit profile of FHA FTBs has improved. However, since 2014 over half of FHA FTBs still have credit scores below 680.
Sustainability Scorecard
In 2018, we proposed defining sustainable homeownership as a FTB paying off their FHA mortgage and purchasing a trade-up home (either with a non-FHA mortgage or a new FHA mortgage) or as the household continuing to pay down its original FHA mortgage or refinancing to a non-FHA mortgage. This leaves two scenarios where the homeownership experience is not sustained: (1) the household defaults on its FHA mortgage, or (2) the household pays off its FHA mortgage but transitions back to renting for at least three years.
There are two challenges to implementing this sustainability scorecard. First, the FHA has a streamline refinance program that allows FHA borrowers to refinance even if their current FHA mortgage is “underwater”—that is, the balance on the FHA mortgage is higher than the current value of the house. Using a streamline refinance allows the borrower to lower their interest rate but does not extinguish the FHA’s credit exposure to the borrower. Rather, the credit exposure is transferred from the purchase mortgage to the refinance. In addition, a borrower can streamline refinance more than once. To correctly measure the default rate, we follow the borrower rather than the mortgage by connecting any streamline refinances to the original FTB purchase mortgage. A default on a streamline refinance is assigned back to the original purchase mortgage.
The second challenge is identifying cases where the borrower successfully pays off the FHA mortgage but transitions back to renting. We identify these cases by observing no new mortgage credit after the sale of the home. We use a minimum rental period of three years to avoid cases where a household moves and rents for a period while deciding where to purchase their trade-up home.
We present our updated FHA FTB homeownership sustainability scorecard below which incorporates an additional eight years of data (2012-19).
FHA FTB Homeownership Sustainability Improved after the Financial Crisis
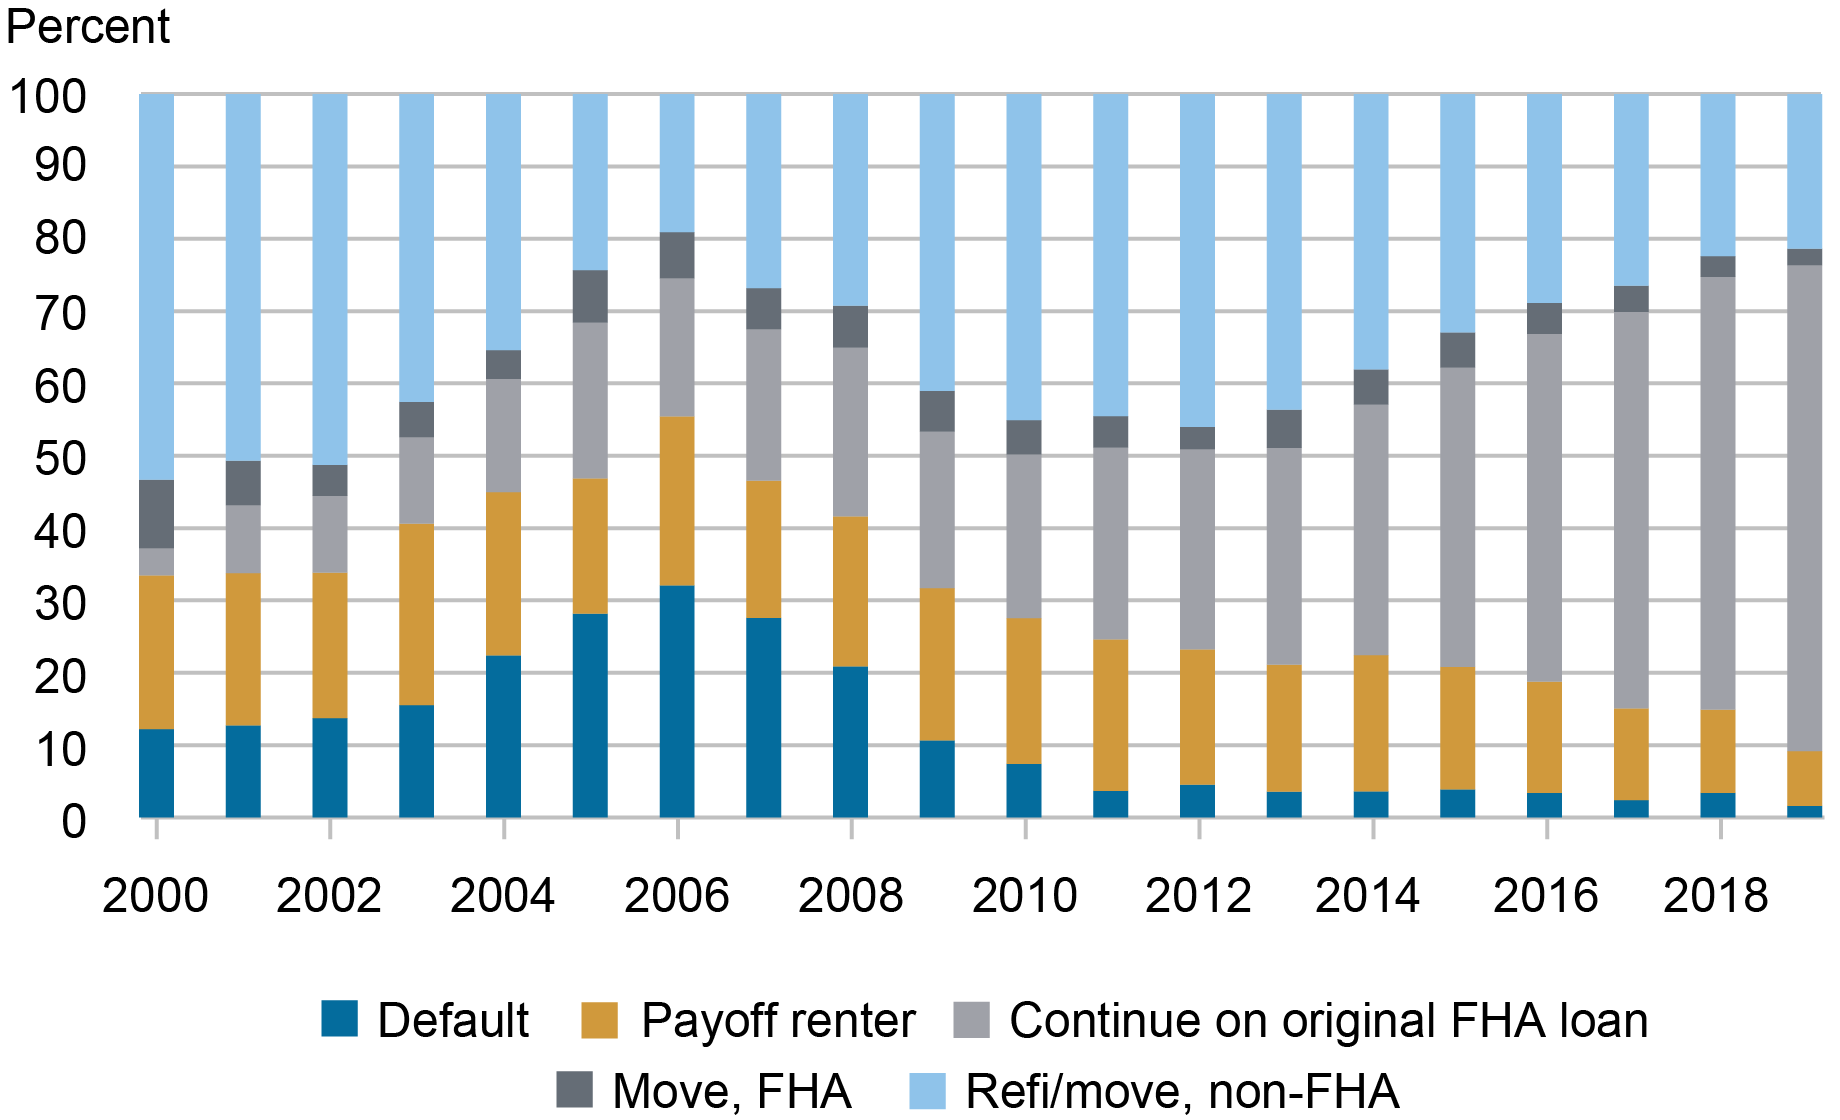
Sources: New York Fed Consumer Credit Panel/Equifax data; authors’ calculations.
Notes: The five categories of outcomes include those who default on their FHA loan, those who pay off their original home but transition to renting again, those who continue on their original FHA loan, those who move and still rely on an FHA-insured mortgage, and those who refinance or move to a home with a non-FHA-insured mortgage. The years are when the mortgages are originated.
Sustainability declined as we approached the financial crisis and the housing bust. In 2006, less than half of FHA FTBs were able to sustain homeownership. The good news is that this was the smallest cohort in terms of total FHA FTB purchase mortgages. Sustainability continued to improve after 2006 and stabilized at around 70 percent in 2010. From 2011 to 2016, FHA FTB sustainability stayed around 75 percent. Further monitoring of the data is necessary to make a firm evaluation of sustainability for the most recent cohorts starting from 2017.
The improvement in the FHA FTB sustainability rate was due primarily to a decline in the default rate from 32 percent in 2006 to 3.4 percent in 2016. However, the share of FHA FTBs transitioning back to renting has remained around 20 percent from 2007 to 2016.
The update to the scorecard shows that the FHA improved its FTB sustainability following the recovery of the housing market after the financial crisis. However, from 2011 to 2016, about 21.8 percent of FHA FTBs failed to sustain their initial homeownership and lost their opportunity to accumulate housing equity.

Donghoon Lee is an economic research advisor in Consumer Behavior Studies in the Federal Reserve Bank of New York’s Research and Statistics Group.
Joseph Tracy is a non-resident senior scholar at the American Enterprise Institute.
How to cite this post:
Donghoon Lee and Joseph Tracy, “FHA First‑Time Buyer Homeownership Sustainability: An Update,” Federal Reserve Bank of New York Liberty Street Economics, November 30, 2023, https://libertystreeteconomics.newyorkfed.org/2023/11/fha-first-time-buyer-homeownership-sustainability-an-update/
BibTeX: View |


Disclaimer
The views expressed in this post are those of the author(s) and do not necessarily reflect the position of the Federal Reserve Bank of New York or the Federal Reserve System. Any errors or omissions are the responsibility of the author(s).
 RSS Feed
 Follow Liberty Street Economics