


In this post, we follow up on the previous Liberty Street Economics post in this series by studying other impacts of extreme weather on the real sector. Data from the Federal Reserve’s Small Business Credit Survey (SBCS) shed light on how small businesses in the Second District are impacted by natural disasters (such as hurricanes, floods, wildfires, droughts, and winter storms). Among our findings are that increasing shares of small business firms in the region sustain losses from natural disasters, with minority-owned firms suffering losses at a disproportionately higher rate than white-owned firms. For many minority-owned firms, these losses make up a larger portion of their total revenues. In a companion post, we will explore the post-disaster recovery of small firms in the Second District: how long do they remain closed and what are their sources of disaster relief?
Vulnerability to Disaster-Related Losses
For this study, we consider small businesses in three states in the Fed’s Second District: New York, New Jersey, and Connecticut (we omit Puerto Rico and the U.S. Virgin Islands due to limited data availability). To start with, we compare their exposures to disaster-related losses with small businesses in other states, using data from the SBCS for the period 2021-22. (Previous Liberty Street Economics posts [see here and here] study disaster vulnerabilities of small businesses nationally for the period 2019-21.) The annual survey provides detailed information on the operations and financial conditions of small businesses with fewer than 500 employees and records the demographics of firm owners. There were 18,190 and 13,910 respondents in the 2021 and 2022 surveys, respectively.
The natural disaster module of the survey asks respondents whether their business sustained any direct or indirect losses from a natural disaster within the past twelve months. As the chart below shows, the fraction of firms reporting natural disaster-related losses in 2021-22 is especially high in the states in our sample, suggesting that a finding of large disparities in disaster vulnerabilities for the region is consequential. Additionally, states along the Gulf Coast and on the West Coast have a high fraction of small businesses reporting disaster-related losses relative to the heartland.
Fraction of Firms Reporting Disaster-Related Losses by State, 2021-22
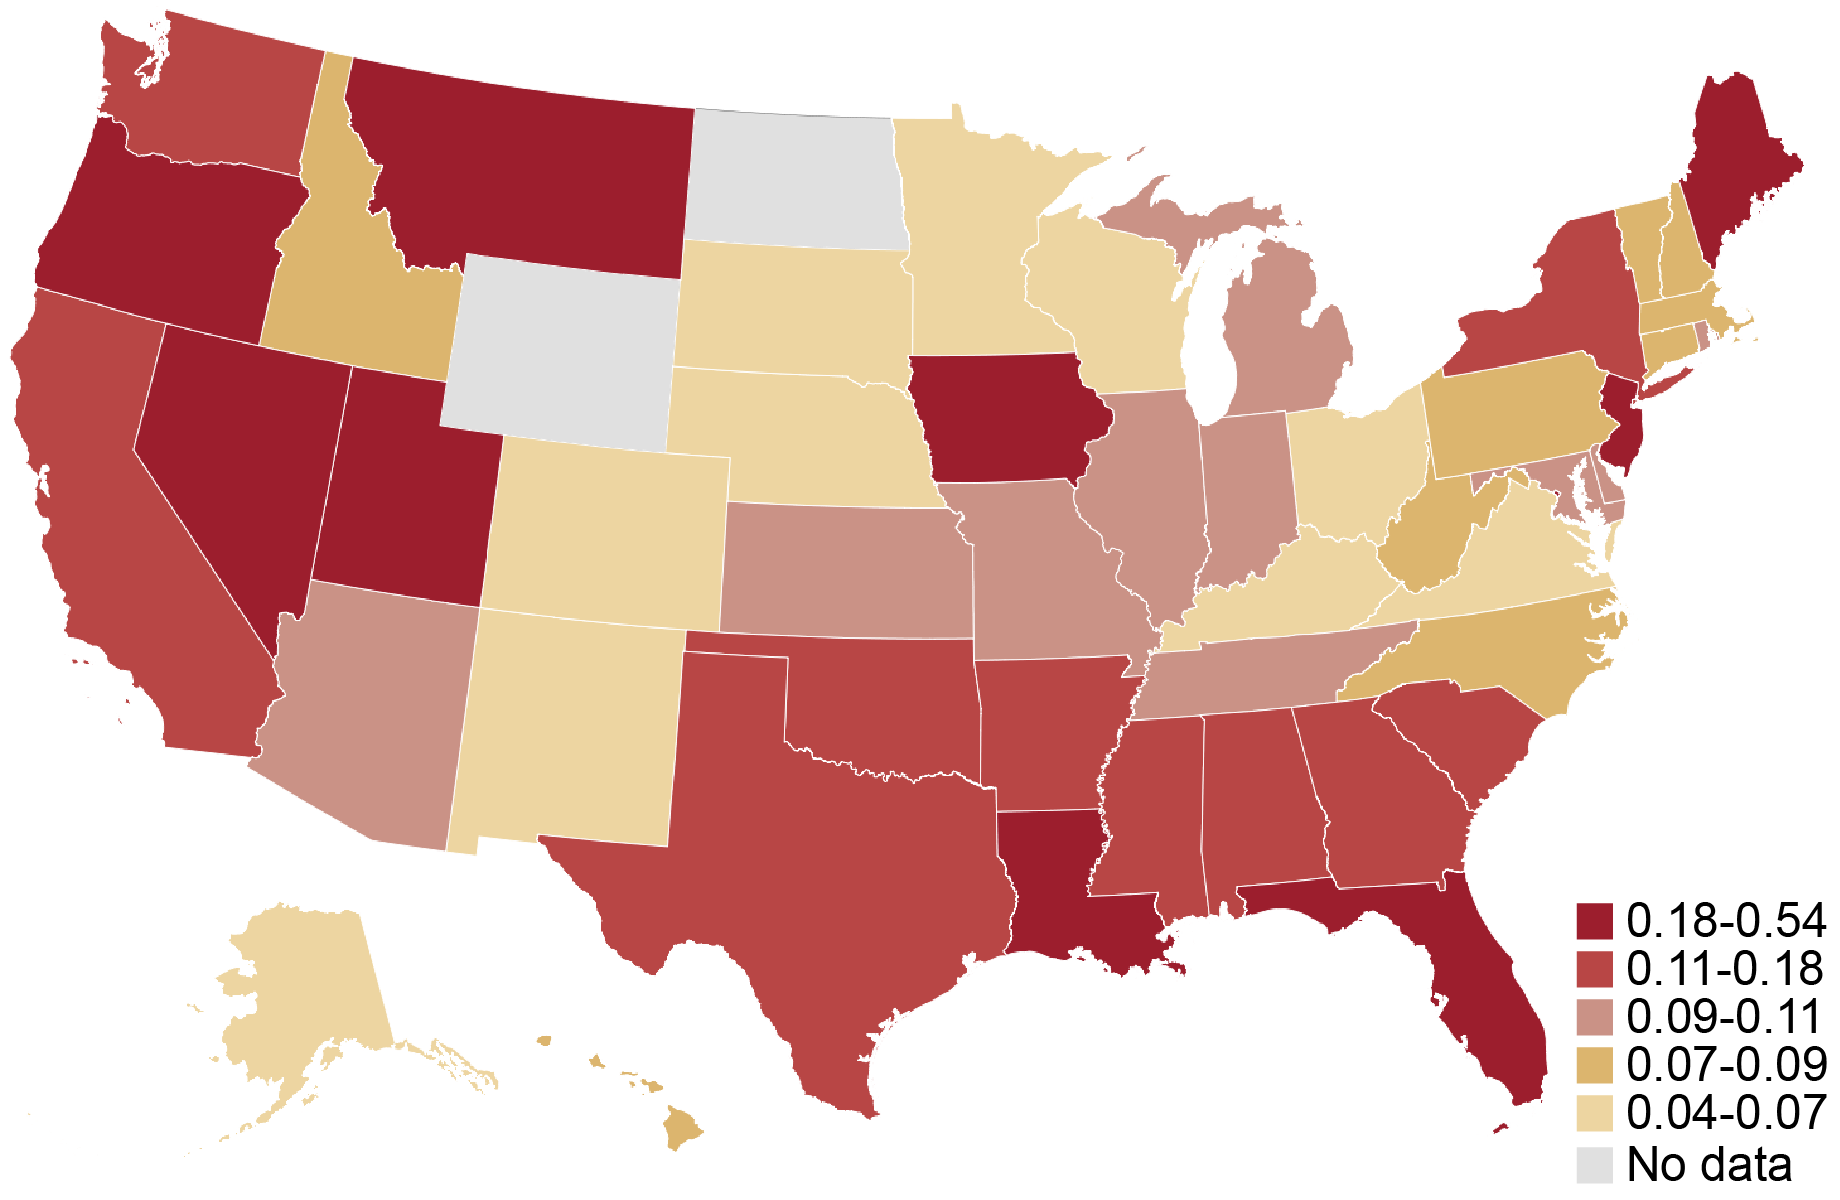
Notes: The heat map shows the fraction of firms in a given state that answered yes to the question “Within the past 12 months, did your business sustain direct or indirect losses from a natural disaster other than COVID-19 (e.g., hurricane, wildfire, earthquake, etc.)?” All observations that are missing a response to the question are excluded from the sample. The sample pools employer and nonemployer firms. Responses by employer and nonemployer firms are weighted separately on a variety of firm characteristics to match the national population of employer and nonemployer firms, respectively. To construct a pooled weight, we use the employer (nonemployer) weight for the sample year if the firm is an employer (nonemployer). The surveys were fielded between September and November of 2021 and 2022.
Are Minority-Owned Small Businesses in the Region More Likely to Report Disaster-Related Losses?
Natural disasters may have a detrimental impact on small businesses and particularly those owned by minorities, which are typically more resource-constrained and thus less resilient. A firm is defined as minority-owned if at least 51 percent of the firm’s equity stake is held by a minority (that is, an Asian, Black, Native American, or Hispanic) owner. A firm is defined as white-owned if at least 50 percent of its equity stake is held by non-Hispanic white owners. Race/ethnicity categories are not mutually exclusive. Disparities in the impact of natural disasters can arise because, for example, low-income and minority Americans are more likely to reside in high-risk flood zones. Conditional on exposure, disparities in the impact of natural disasters are also related to existing inequalities induced by historical practices like redlining.
We report the fraction of firms experiencing disaster-related losses in the Second District states, extending the data back to 2019. For firms overall, this fraction rose from 2 percent in 2019 to 18 percent in 2021 before stabilizing (see the left panel of the chart below). By race and ethnicity, we see disparities increasing continuously after 2019 (a year in which no minority firms in the three states in our sample reported experiencing natural disasters). In 2020, 4 percent of white-owned firms and 9 percent of minority-owned firms reported disaster-related losses; both of those percentages rose in 2021 and further again in 2022 to 12 percent and 29 percent, respectively (see the right panel in the chart below).
Qualitatively similar results obtain for the national sample although, by comparison, the disparity was lower in all years since 2020 (not pictured). The fraction of firms reporting disasters grew from about 7 percent in 2019 to about 15 percent in 2022 and disparities also rose alongside. For example, in 2022, 22 percent of minority-owned businesses faced disaster-related losses nationally versus 12 percent of white-owned businesses.
The Fraction of Firms in the Region with Losses and Disparities in Losses Have Both Increased since 2019
Percent
Percent
Source: Federal Reserve Banks, 2022, 2021, 2020, and 2019 Small Business Credit Surveys. Notes: For respondents in each year and race/ethnicity category, the lines show the percentage of firms in the sample that answered yes to the question “Within the past 12 months, did your business sustain direct or indirect losses from a natural disaster other than COVID-19 (e.g., hurricane, wildfire, earthquake, etc.)?” A firm is defined as minority-owned if at least 51 percent of the firm’s equity stake is held by a minority (that is, an Asian, Black, Native American, or Hispanic) owner. A firm is defined as white-owned if at least 50 percent of its equity stake is held by non-Hispanic white owners. Race/ethnicity categories are not mutually exclusive. An observation is excluded from the sample if it is missing a response to the question or if the owner’s race is not observed. The sample pools employer and nonemployer firms. Responses by employer and nonemployer firms are weighted separately on a variety of firm characteristics to match the national population of employer and nonemployer firms, respectively. To construct a pooled weight, we use the employer (nonemployer) weight for the sample year if the firm is an employer (nonemployer). The surveys were fielded between September and November of each calendar year.
Among those small businesses located in disaster-affected areas in the sample, more minority-owned firms faced damages than white-owned firms. We show this by focusing on the subsample of small businesses located in counties designated as disaster-affected by the Federal Emergency Management Agency (FEMA) in the period of the survey. We find that 29 percent of minority-owned firms reported disaster-related losses in 2021 and 2022, compared to 12 percent of white-owned firms.
Do Minority-Owned Firms in the Region Suffer Larger Disaster-Related Losses?
The 2021 and 2022 surveys ask firms reporting disaster-related losses to estimate the value of losses resulting from natural disaster(s) and their revenues in the year prior. We normalize these losses as a percentage of a firm’s total revenue in the year prior.
Minority-owned businesses in the three states are disproportionately likely to experience disaster-related losses that were a large share of their revenues (see the chart below). For example, 38 percent of minority-owned businesses reported losses that amount to over 60 percent of 2019 revenue whereas just 18 percent of white-owned firms reported similar losses. In contrast, white-owned businesses were more likely to suffer moderate disaster-related losses. For example, 65 percent of white-owned firms experienced disaster-related losses of less than 30 percent while about 50 percent of minority-owned firms had similar losses. Qualitatively similar results obtain for the national sample (not pictured). For example, the share of minority-owned firms experiencing normalized losses of over 60 percent was about 30 percent as compared to 22 percent of white-owned firms.
More Minority-Owned Firms in the Region Have High Revenue Shares of Disaster-Related Losses
Percent
Notes: Among firms that reported disaster-related losses, the 2021 and 2022 SBCS asks “What is the estimated value of your business’s losses as a result of the natural disaster?” Respondents can select from six categories. Firms are also asked to report their total revenues from 2019 by selecting from eight ranges. To compute the normalized revenue loss, we divide the midpoint of the disaster-related losses range by the midpoint of the firm’s revenue range. The normalized losses are grouped into four bins, which are shown on the x-axis. The bars show the percentage of firms in each race/ethnicity category with normalized disaster-related losses in a given bin. A firm is defined as minority-owned if at least 51 percent of the firm’s equity stake is held by a minority (that is, an Asian, Black, Native American, or Hispanic) owner. A firm is defined as white-owned if at least 50 percent of its equity stake is held by non-Hispanic white owners. Race/ethnicity categories are not mutually exclusive. An observation is excluded from the sample if it is missing a response to the question or if owner race is not observed. The sample pools employer and nonemployer firms. Responses by employer and nonemployer firms are weighted separately on a variety of firm characteristics to match the national population of employer and nonemployer firms, respectively. To construct a pooled weight, we use the employer (nonemployer) weight for the sample year if the firm is an employer (nonemployer). The surveys were fielded between September and November of 2021 and 2022.
The distribution of normalized losses is mostly driven by lower revenues of minority-owned firms, suggesting that natural disasters are a greater burden for minority-owned firms because they amplify existing racial disparities (related to, for example, harder access to start-up capital and credit) that have a negative effect on small business revenues.
A concern might be that, for 2021, our results are driven by greater revenue losses of minority-owned firms during the COVID-19 pandemic of 2020. To address this concern, we study normalized losses for 2022 alone and find a similar pattern. The results are also consistent with the distribution of normalized losses in 2020.
Looking Ahead
Our findings suggest that small businesses owned by minorities in the region have been more vulnerable to natural disasters than white-owned firms. Minority-owned small businesses nationally face challenges in accessing credit and are located in areas with underinvestment in climate infrastructure, and these challenges remain salient for the Second District. In the following post, we examine the resources that small businesses can rely on to cope with losses following disasters, such as access to disaster relief.

Asani Sarkar is a financial research advisor in Non-Bank Financial Institution Studies in the Federal Reserve Bank of New York’s Research and Statistics Group.
How to cite this post:
Asani Sarkar, “How Do Natural Disasters Affect Small Business Owners in the Fed’s Second District?,” Federal Reserve Bank of New York Liberty Street Economics, November 15, 2023, https://libertystreeteconomics.newyorkfed.org/2023/11/how-do-natural-disasters-affect-small-business-owners-in-the-feds-second-district/
BibTeX: View |
Disclaimer
The views expressed in this post are those of the author(s) and do not necessarily reflect the position of the Federal Reserve Bank of New York or the Federal Reserve System. Any errors or omissions are the responsibility of the author(s).
 RSS Feed
 Follow Liberty Street Economics
There is no such thing as a “natural disaster”. There are only natural hazards that turn into disasters when humans neglect to design their communities adequately to survive the hazard without significant damage and losses. Calling it a natural disaster gives people the impression that there is nothing we can do to prevent them. We cannot prevent the natural hazard, but we can definitely prevent it turning into a disaster. We already know how to do this for every natural hazard, we just need the political will at the state and community level to mandate resilient design that exceeds the bare minimum provided by typical building codes.