


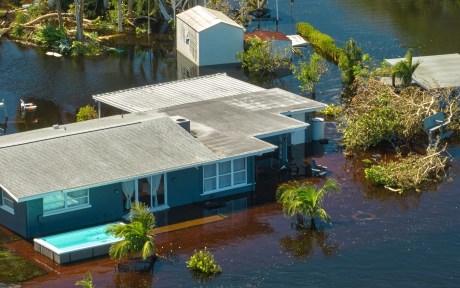
The intensity, duration, and frequency of flooding have increased over the past few decades. According to the Federal Emergency Management Agency (FEMA), 99 percent of U.S. counties have been impacted by a flooding event since 1999. As the frequency of flood events continues to increase, the number of people, buildings, and agriculture exposed to flood risk is only likely to grow. As a previous post points out, measuring the geographical accuracy of such risk is important and may impact bank lending. In this post, we focus on the distribution of flood risk within the Federal Reserve’s Second District and examine its effect on establishment location decisions over the last two decades.
Where Is Flood Risk Concentrated in the Second District?
Coastal flooding occurs when water inundates or covers normally dry coastal land, while riverine flooding occurs when streams and rivers exceed their natural or constructed capacity. We leverage county-level data on both coastal and riverine flood risk scores, provided by the FEMA National Risk Index (NRI), to build an aggregate flood risk score for counties in the Second District as of March 2023. We sort Second District counties into risk quartiles and plot their distributions in Panel 1 (Puerto Rico and the U.S. Virgin Islands are omitted due to insufficient data).
Flood Distribution in the Fed’s Second District
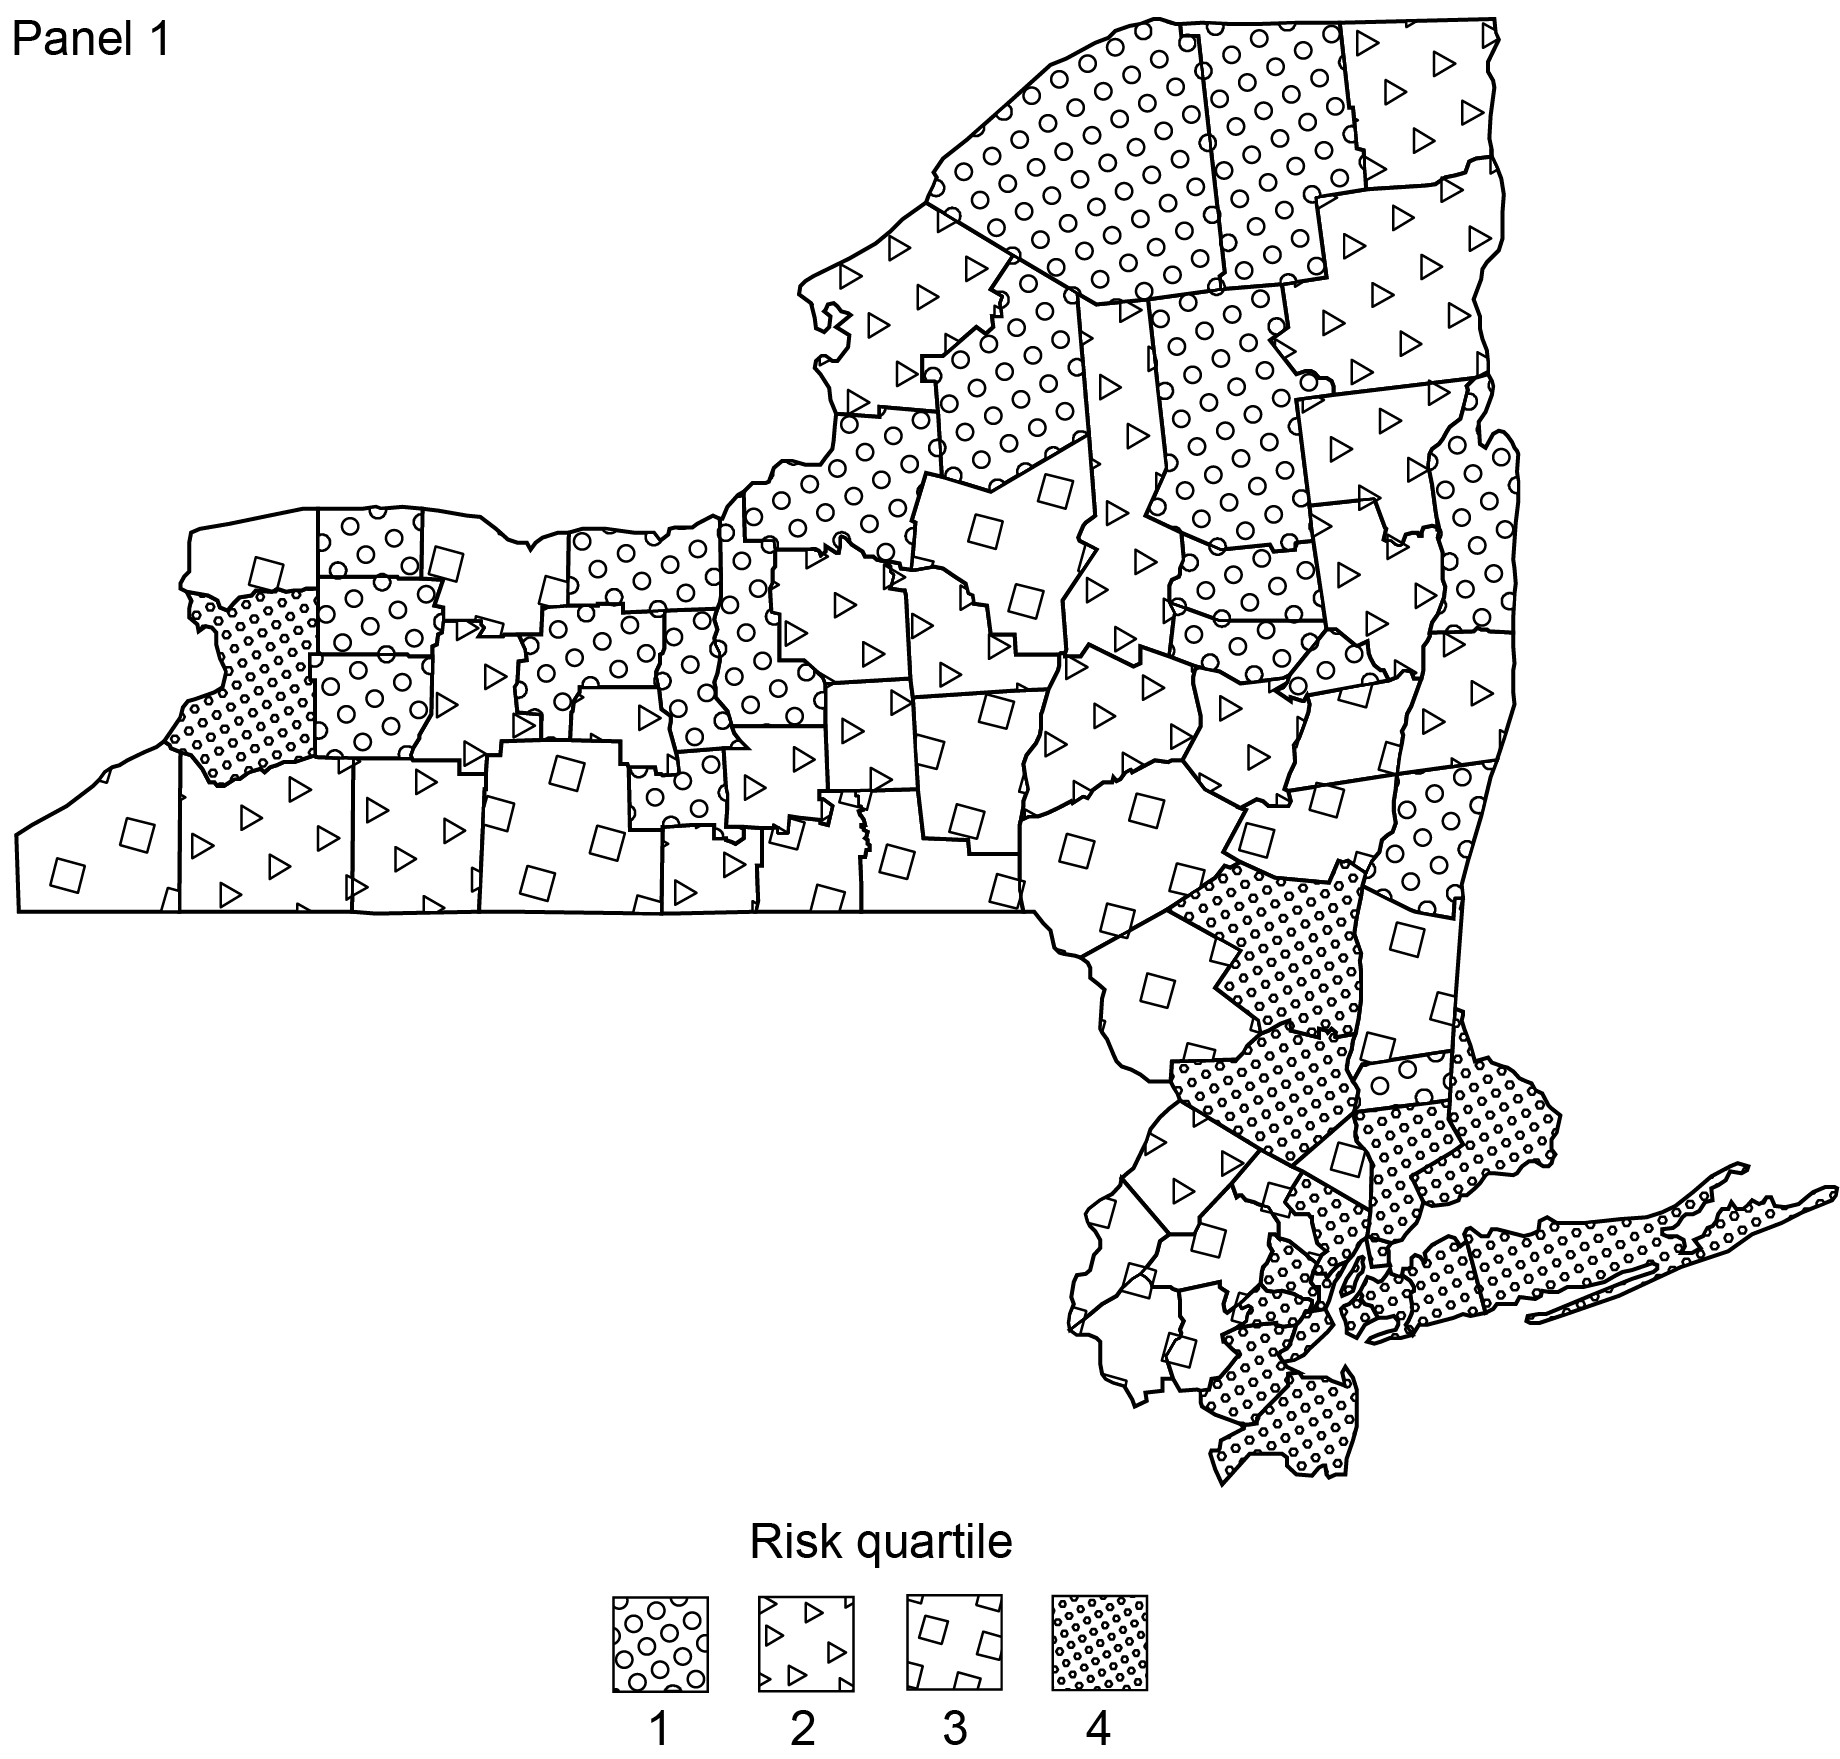
Source: Federal Emergency Management Agency.
Note: Higher risk quartiles correspond to higher flood risk.
The counties with the highest flood risk in the Second District also tend to be the most populated; the correlation between flood risk score and population is 0.78. All ten of the most populated counties in the Second District are also in the top quartile of flood risk score and make up nearly three-fourths of the total population of New York State, according to population data recorded in FEMA’s Hazus 6.0 release. Geographically, the riskiest counties are concentrated in the Long Island, South-Eastern, and City Metro Regions of New York. The two exceptions lie in Fairfield County, located in Connecticut, and Erie County, home of Buffalo and located in the North-Eastern region. Combined, high-risk counties account for over $3 trillion in building value and $775 million in agricultural value, based on the authors’ calculations using county-level FEMA NRI data.
Are New Firms Avoiding Flood-Prone Counties?
To understand the evolution of establishment location relative to flood risk, we use county-level data on establishment locations from the National Establishment Time Series (NETS). An establishment refers to an economic unit that engages in a business activity at a single physical location. NETS reports business sector microdata, enabling us to observe county-level establishment counts across time.
We begin by plotting the distribution of the number of establishments over the flood risk map, as presented in Panel 2a below. We preserve the patterns of the riskiest and safest counties from Panel 1 to illustrate their contrast. Panel 2a highlights that back in 2000, establishments tended to be concentrated in the riskiest counties—the correlation between the number of establishments and our flood risk score is 0.71. This correlation likely reflects the fact that population in the Second District is predominantly concentrated in counties with high exposure to flood risk; indeed, the correlation between the number of establishments and population size is 0.83 across counties.
Concentration and Growth of Establishments
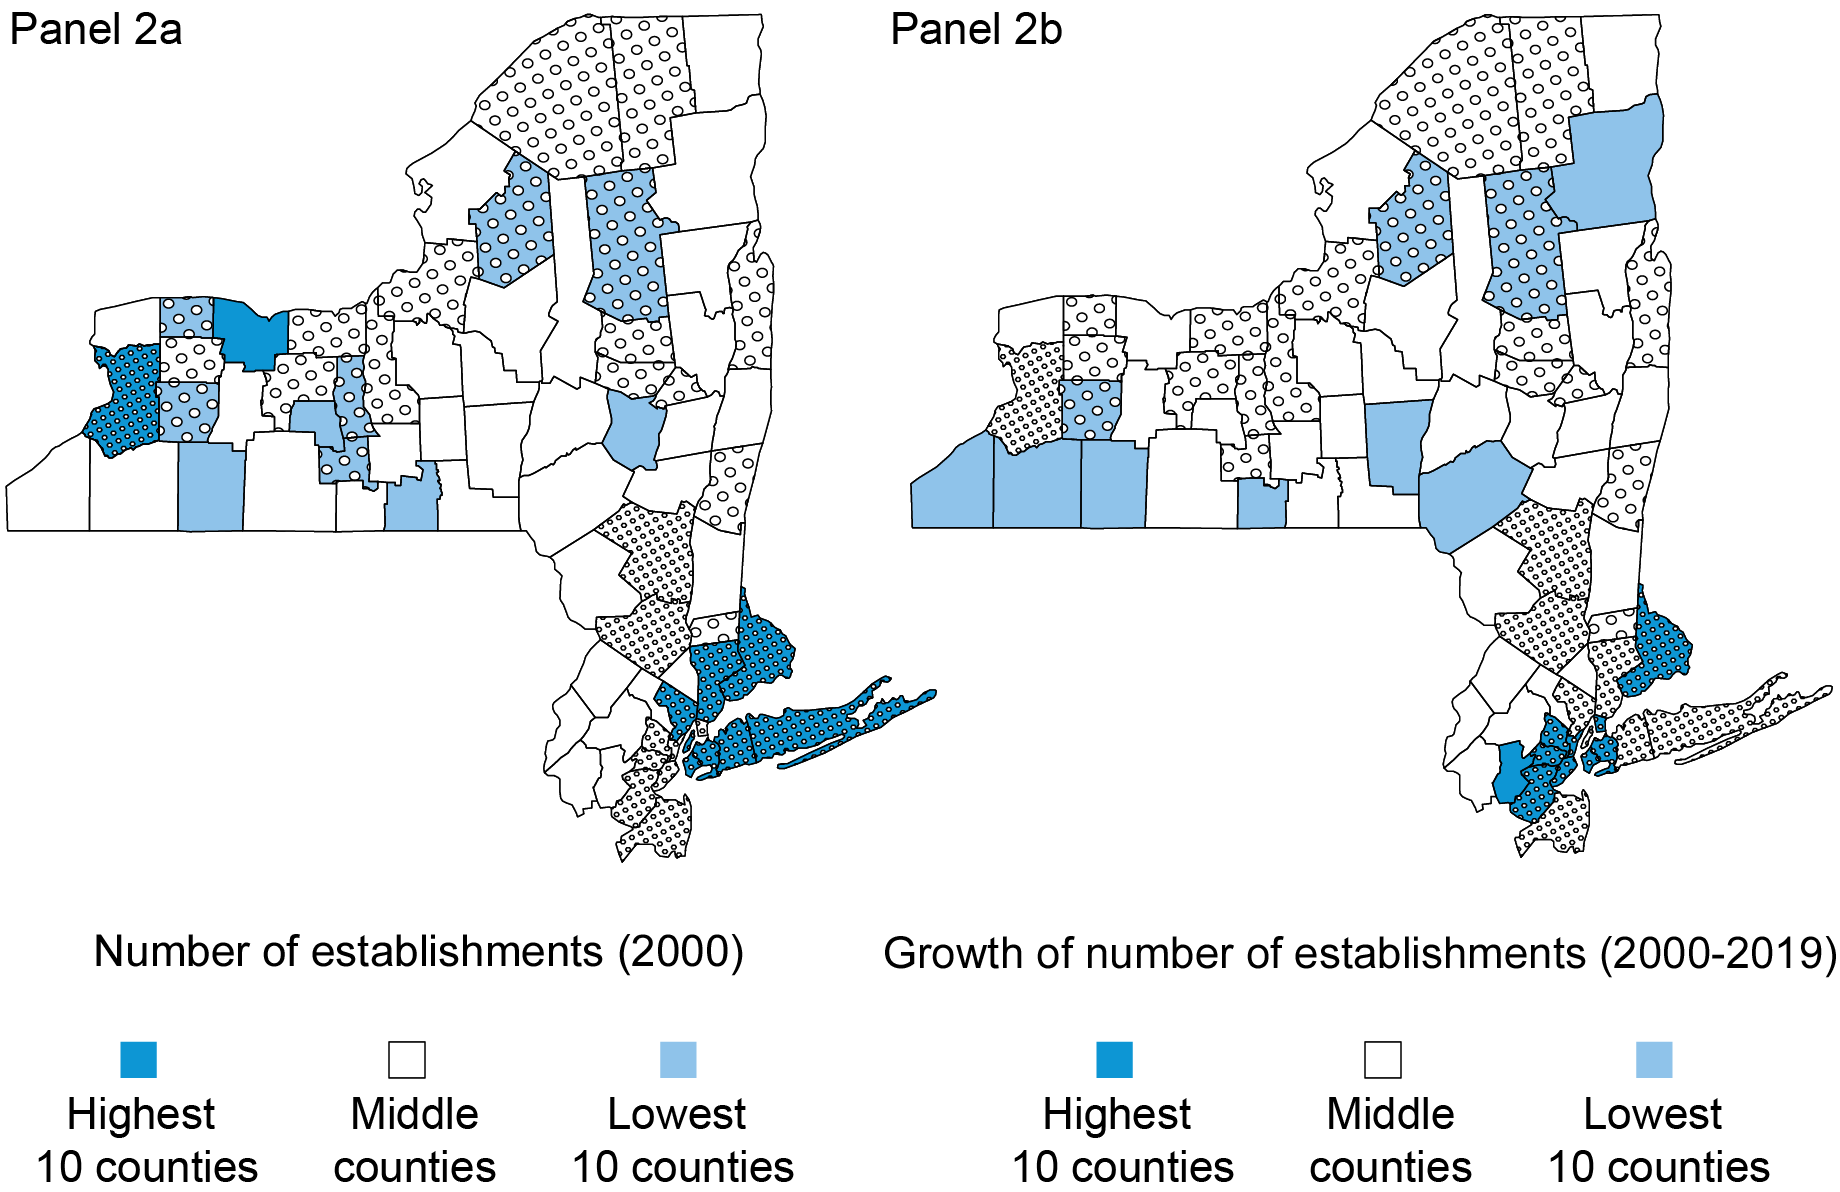
Sources: National Establishment Time Series (NETS); Federal Emergency Management Agency.
Notes: Panel 2b shows the distribution of the ratio of establishments in 2019 to 2000 across all industries.
To get a sense of the potential importance that flood risk may have played in business owners’ geographical location decisions within the Second District, we plot the distribution of the growth of the number of establishments between 2000 and 2019 in Panel 2b, overlaid with the flood risk map as of March 2023. We use flood risk data as of March 2023 because historical data are unavailable.
Interestingly, the counties with the highest growth rates in the number of establishments were not the counties with the lowest risk of flooding; to the contrary, the riskiest counties recorded the fastest pace of establishment growth. Similarly, the counties with the lowest rates of establishment growth were not the riskiest counties but rather relatively safe counties. To control for population size, we conduct the same analysis based on the number of establishments per person, yielding consistent results. Based on these trends, flood risk does not seem to have been the primary determinant of business location decisions.
Of course, it is plausible that the observed lack of importance of flood risk in influencing establishment location may be driven by the first half of our sample period. After all, attention to the risk of climate change has increased over time. To ascertain whether this is the case, we replicate Panel 2b in Panels 3a and 3b, but for the periods preceding and following Hurricane Sandy (October 2012), one of the most damaging hurricanes in the United States to this point, causing $50 billion in damages. While there appears to be a change in the composition of high growth counties before and after Hurricane Sandy, the shift is observed primarily within risk quartiles, rather than across them, consistent with Panel 2b.
Establishment Growth Before and After Hurricane Sandy
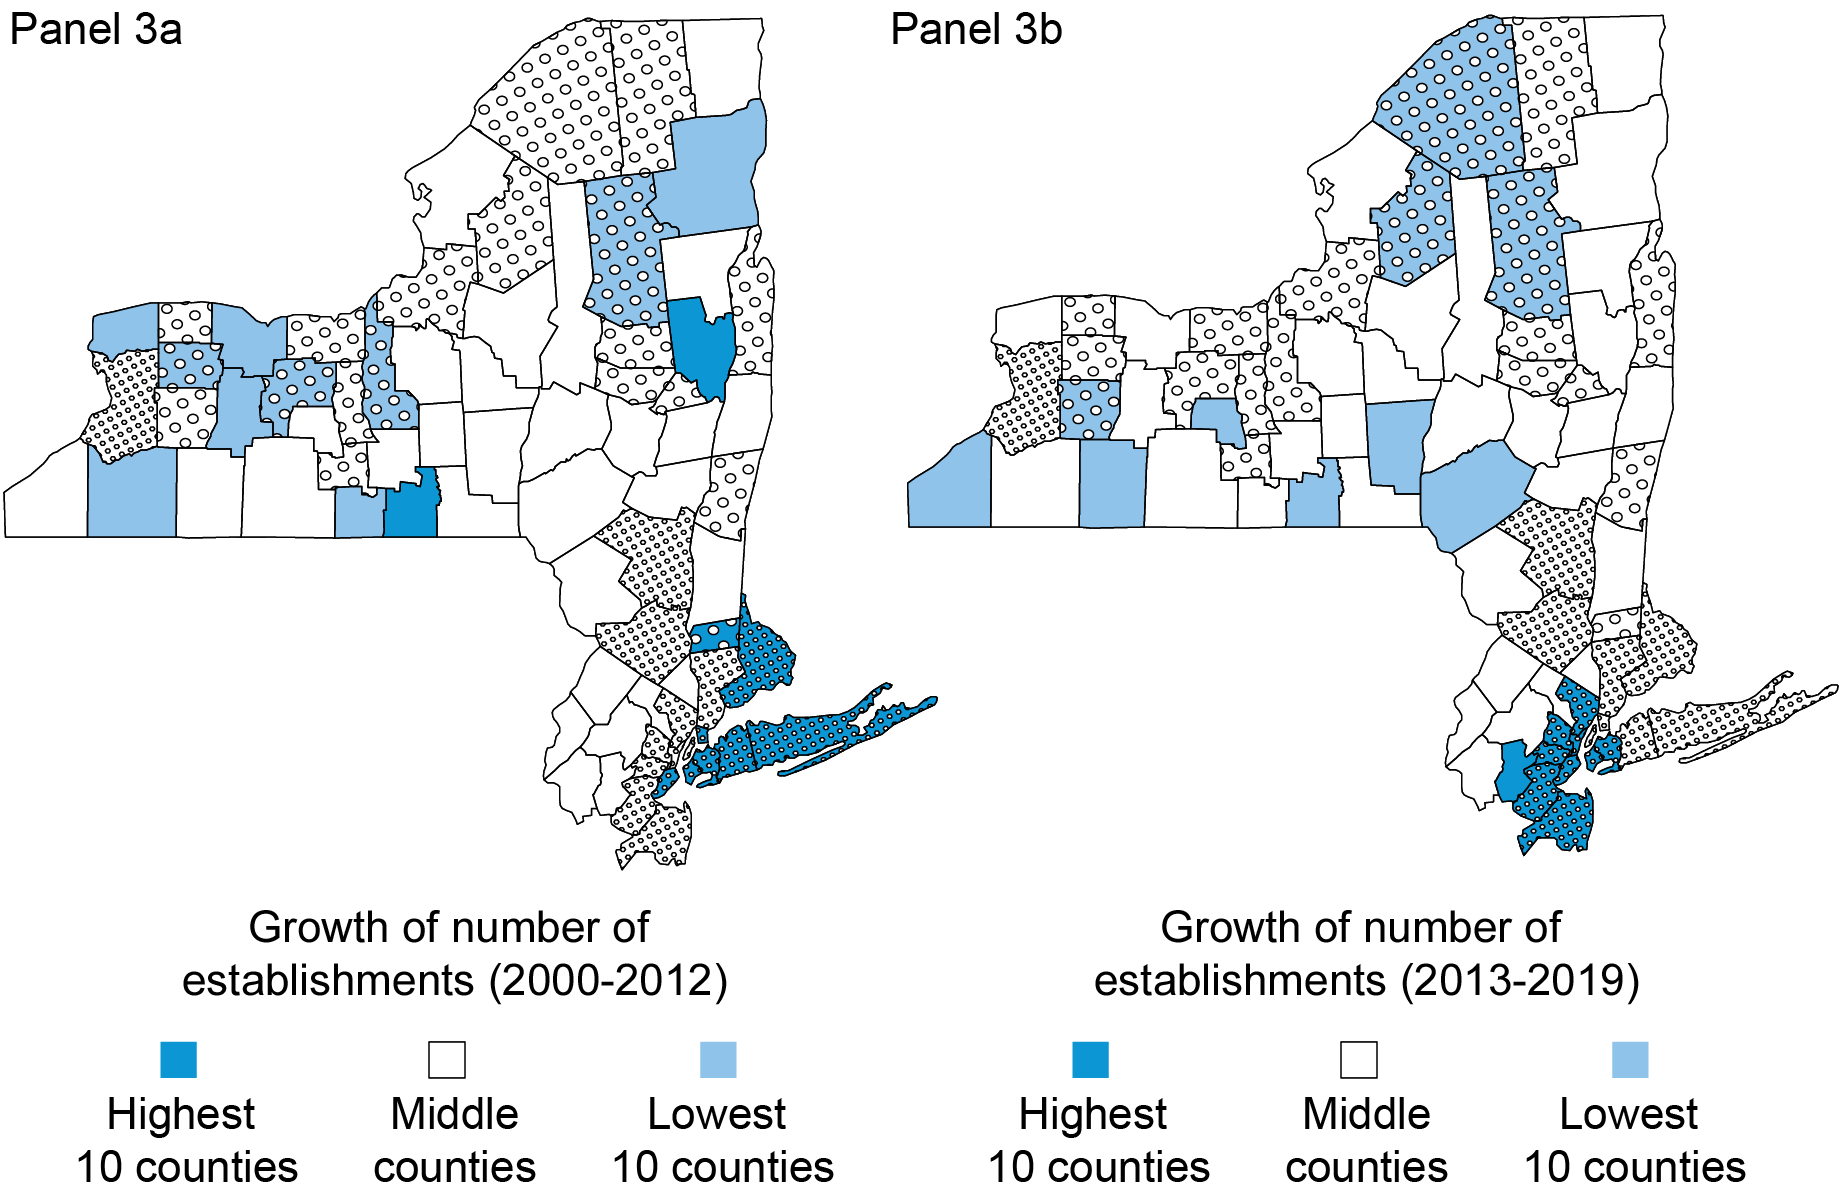
Sources: National Establishment Time Series (NETS); Federal Emergency Management Agency.
Establishments’ Geographical Location by Industry
To further understand the potential importance of flood risk on establishments’ location decisions, we investigate growth rates over the last two decades for establishments in the three most prevalent industries in the Second District based on SIC2 code classification: Business, Health, and Engineering & Management services. Business services encompass establishments primarily engaged in providing services, on a contract or fee basis, such as advertising, mailing, computer programming, and help supply services. Health Services, in turn, includes establishments primarily engaged in furnishing medical, surgical, and other health services. Finally, Engineering & Management establishments primarily engage in providing engineering, architectural, and surveying services (for example, accounting, research, and public relations services).
We plot the growth of the number of establishments for each of these industries in Panels 4-6. Interestingly, Panel 4 shows that four of the safest counties ranked among the top ten in terms of Business Service establishment growth. However, five of the top ten growth rates in this category were also claimed by counties in the riskiest quartile; and the top three counties overall are all located in the flood-prone New York City Metro region. Similar patterns are observed when examining growth rates for Health Service establishments and Engineering & Management Service establishments (see Panels 5 and 6). Overall, these findings are consistent with the evidence observed for all industries—we do not find evidence of a migration of establishments from high-risk areas to low-risk areas.
Growth in Number of Business Service Establishments,
2000-19
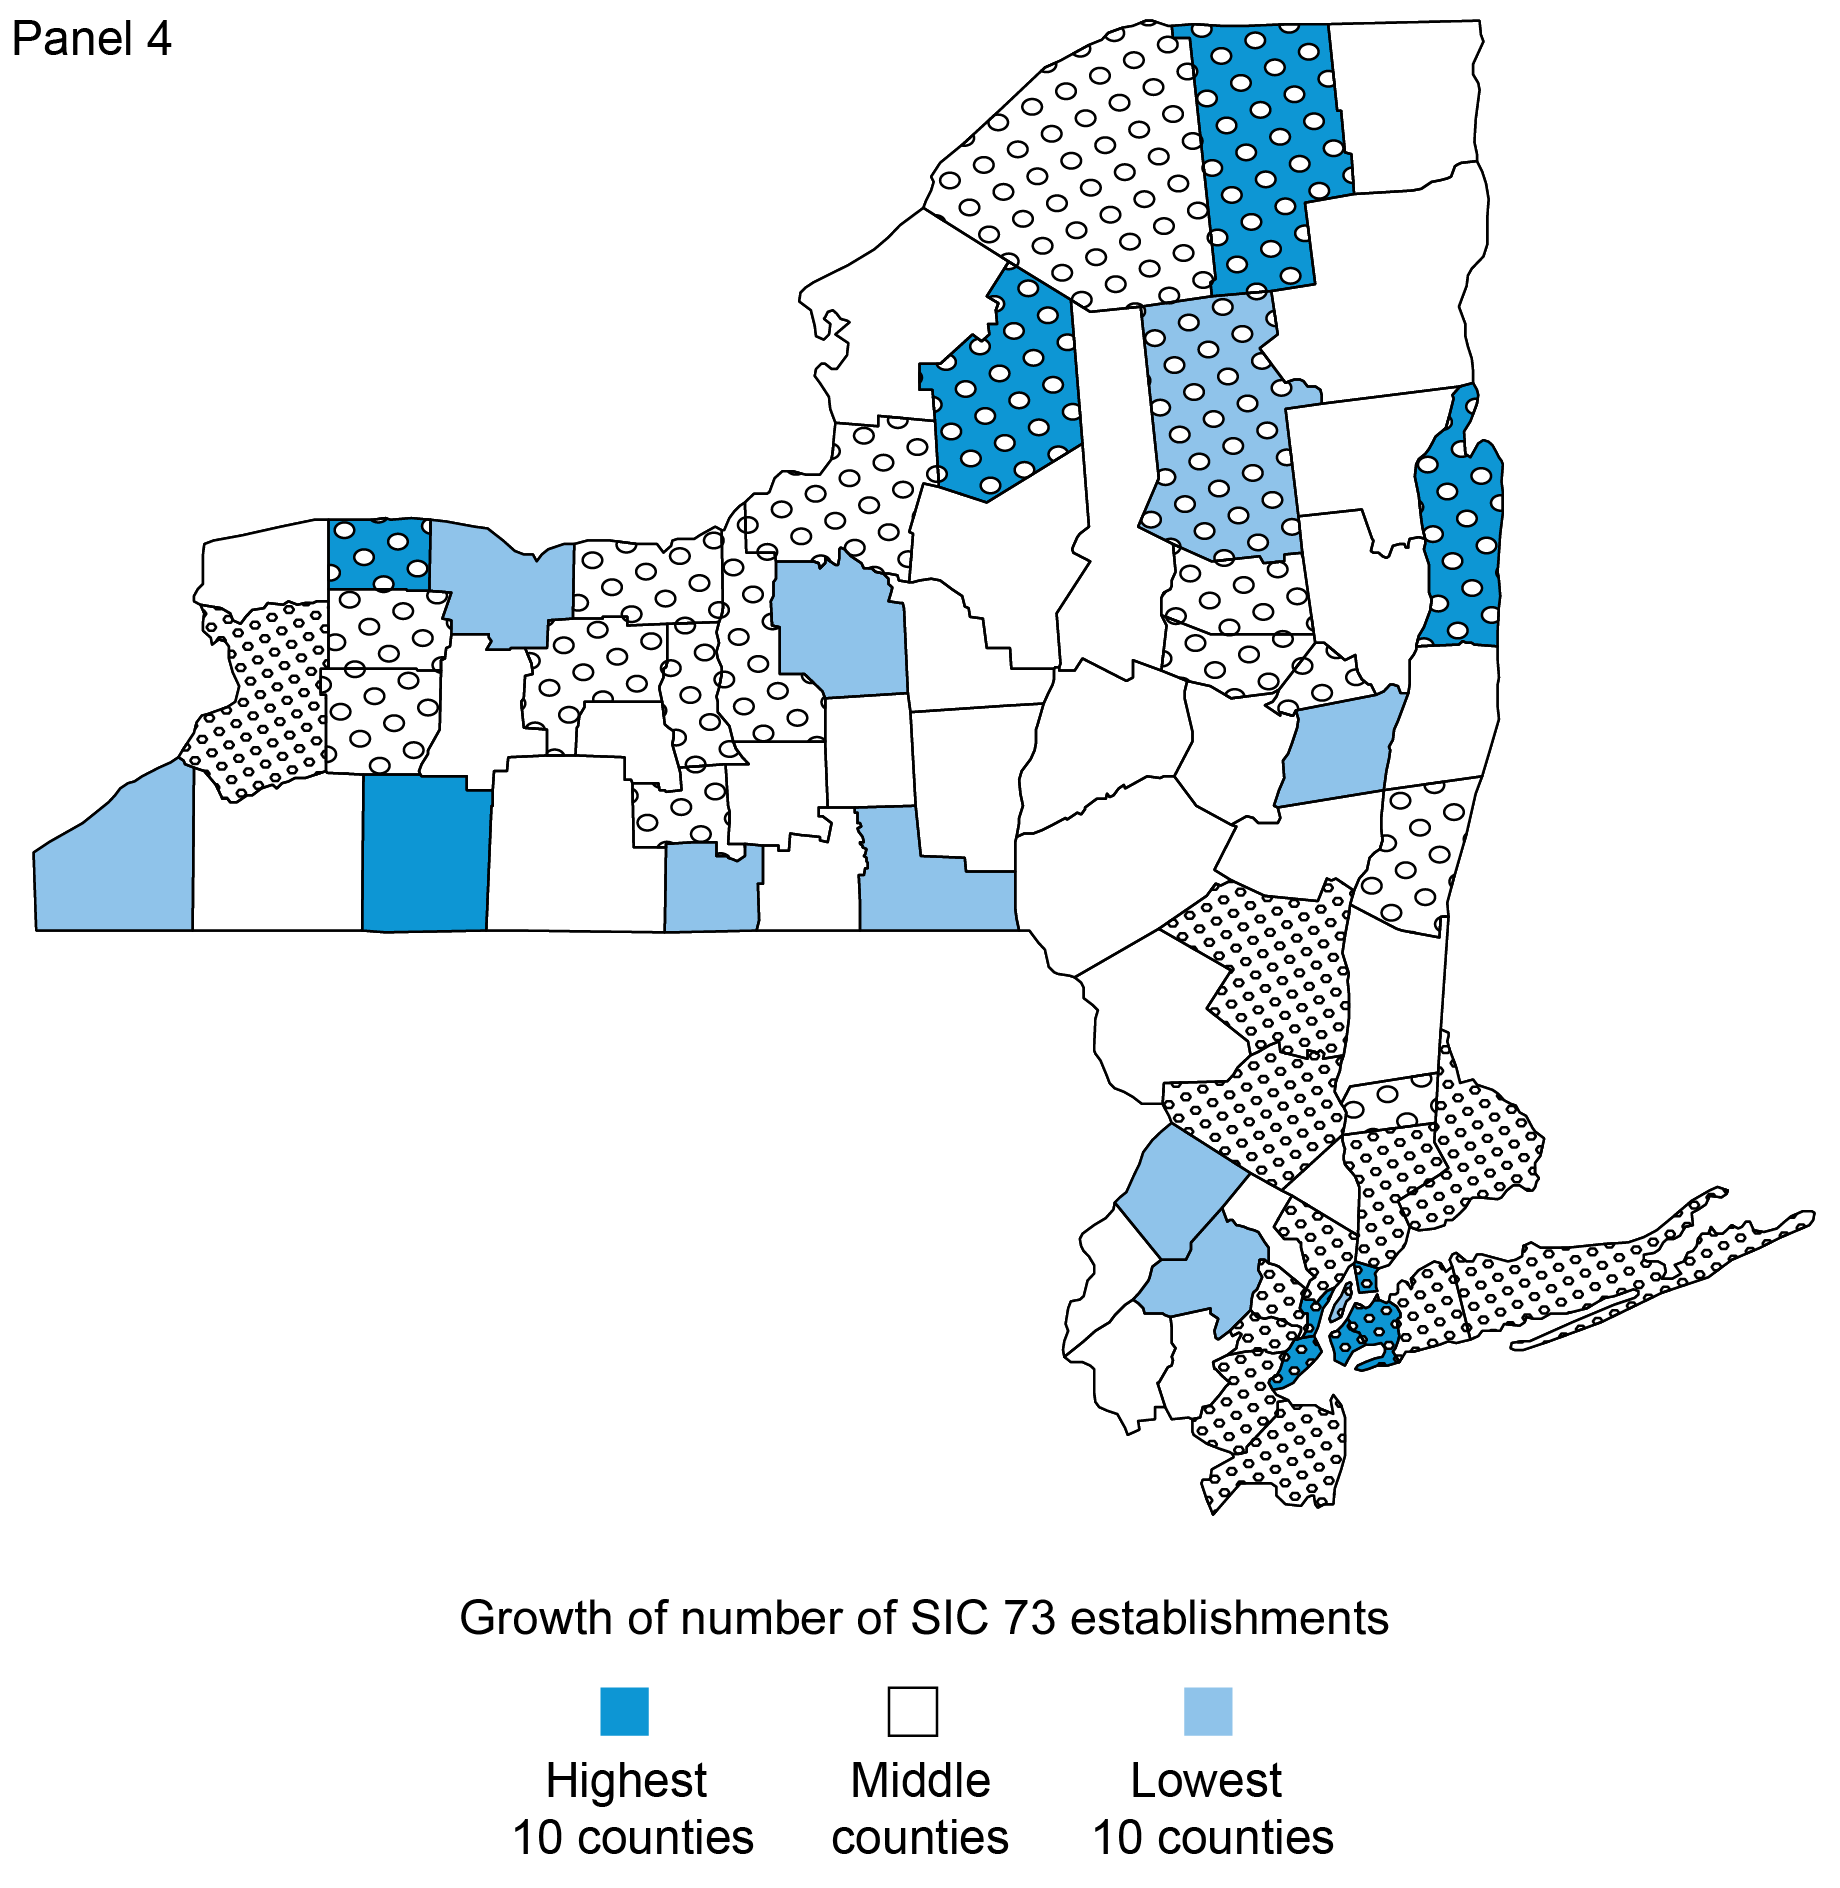
Sources: National Establishment Time Series (NETS); Federal Emergency Management Agency.
Growth in Number of Health Service Establishments,
2000-19
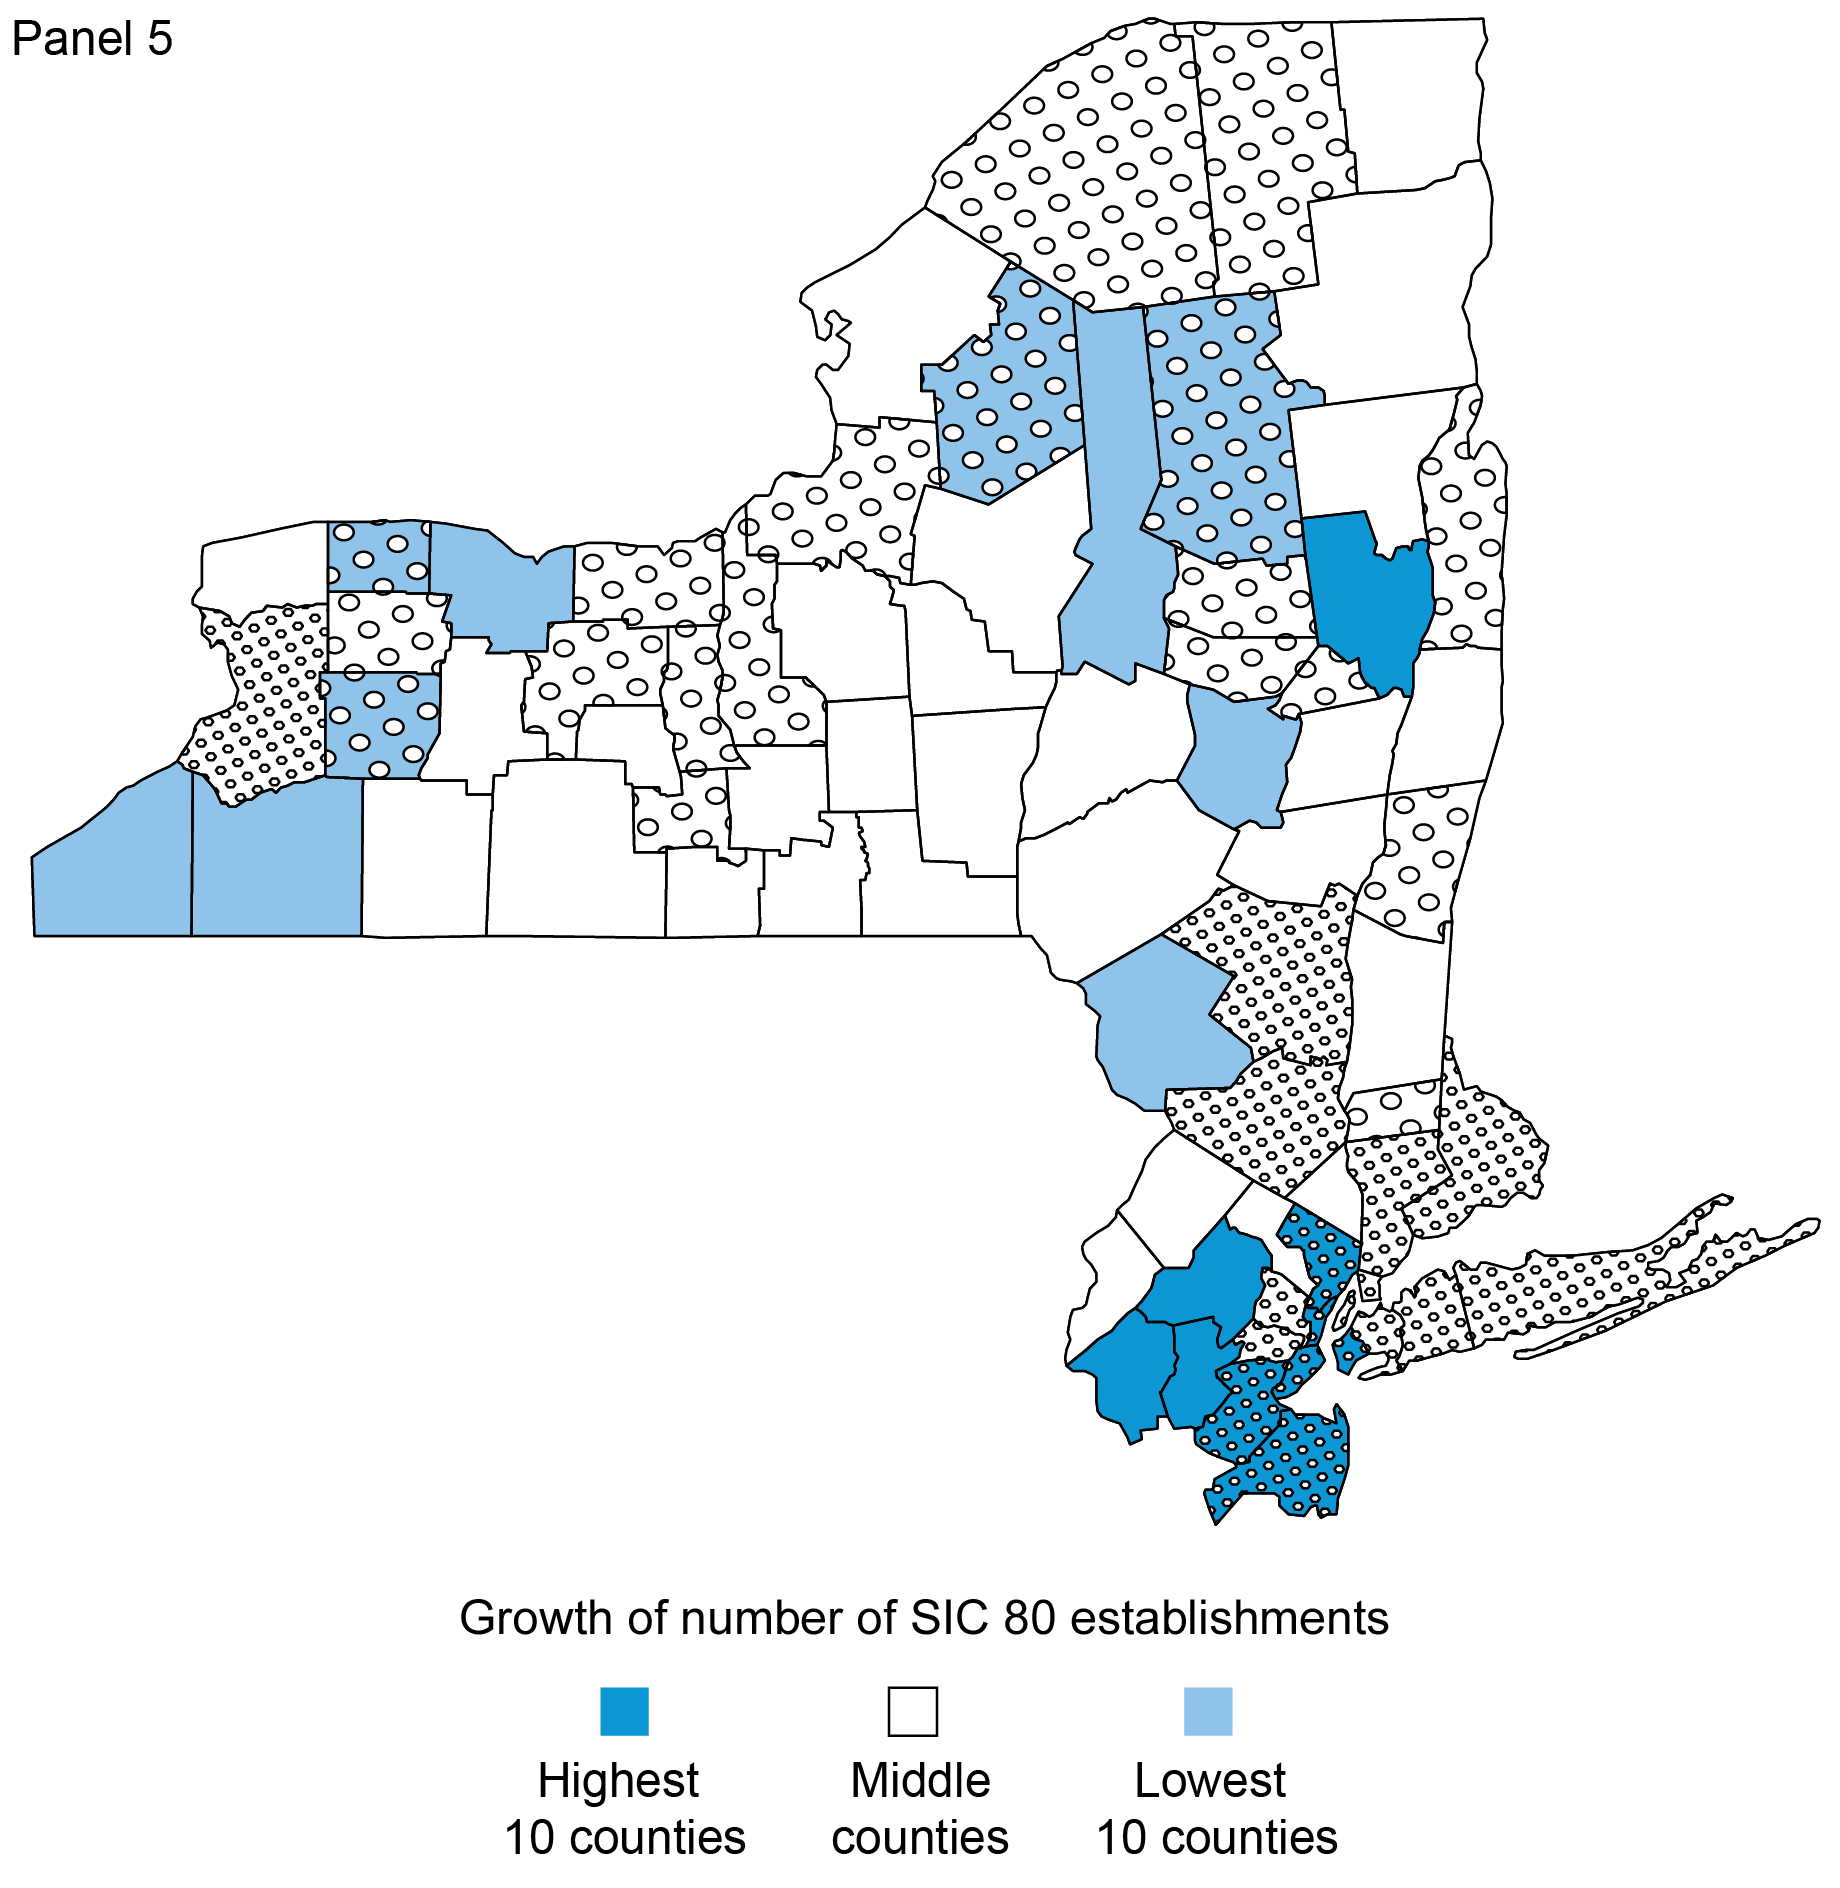
Sources: National Establishment Time Series (NETS); Federal Emergency Management Agency.
Growth in Number of Engineering & Management Service Establishments, 2000-19
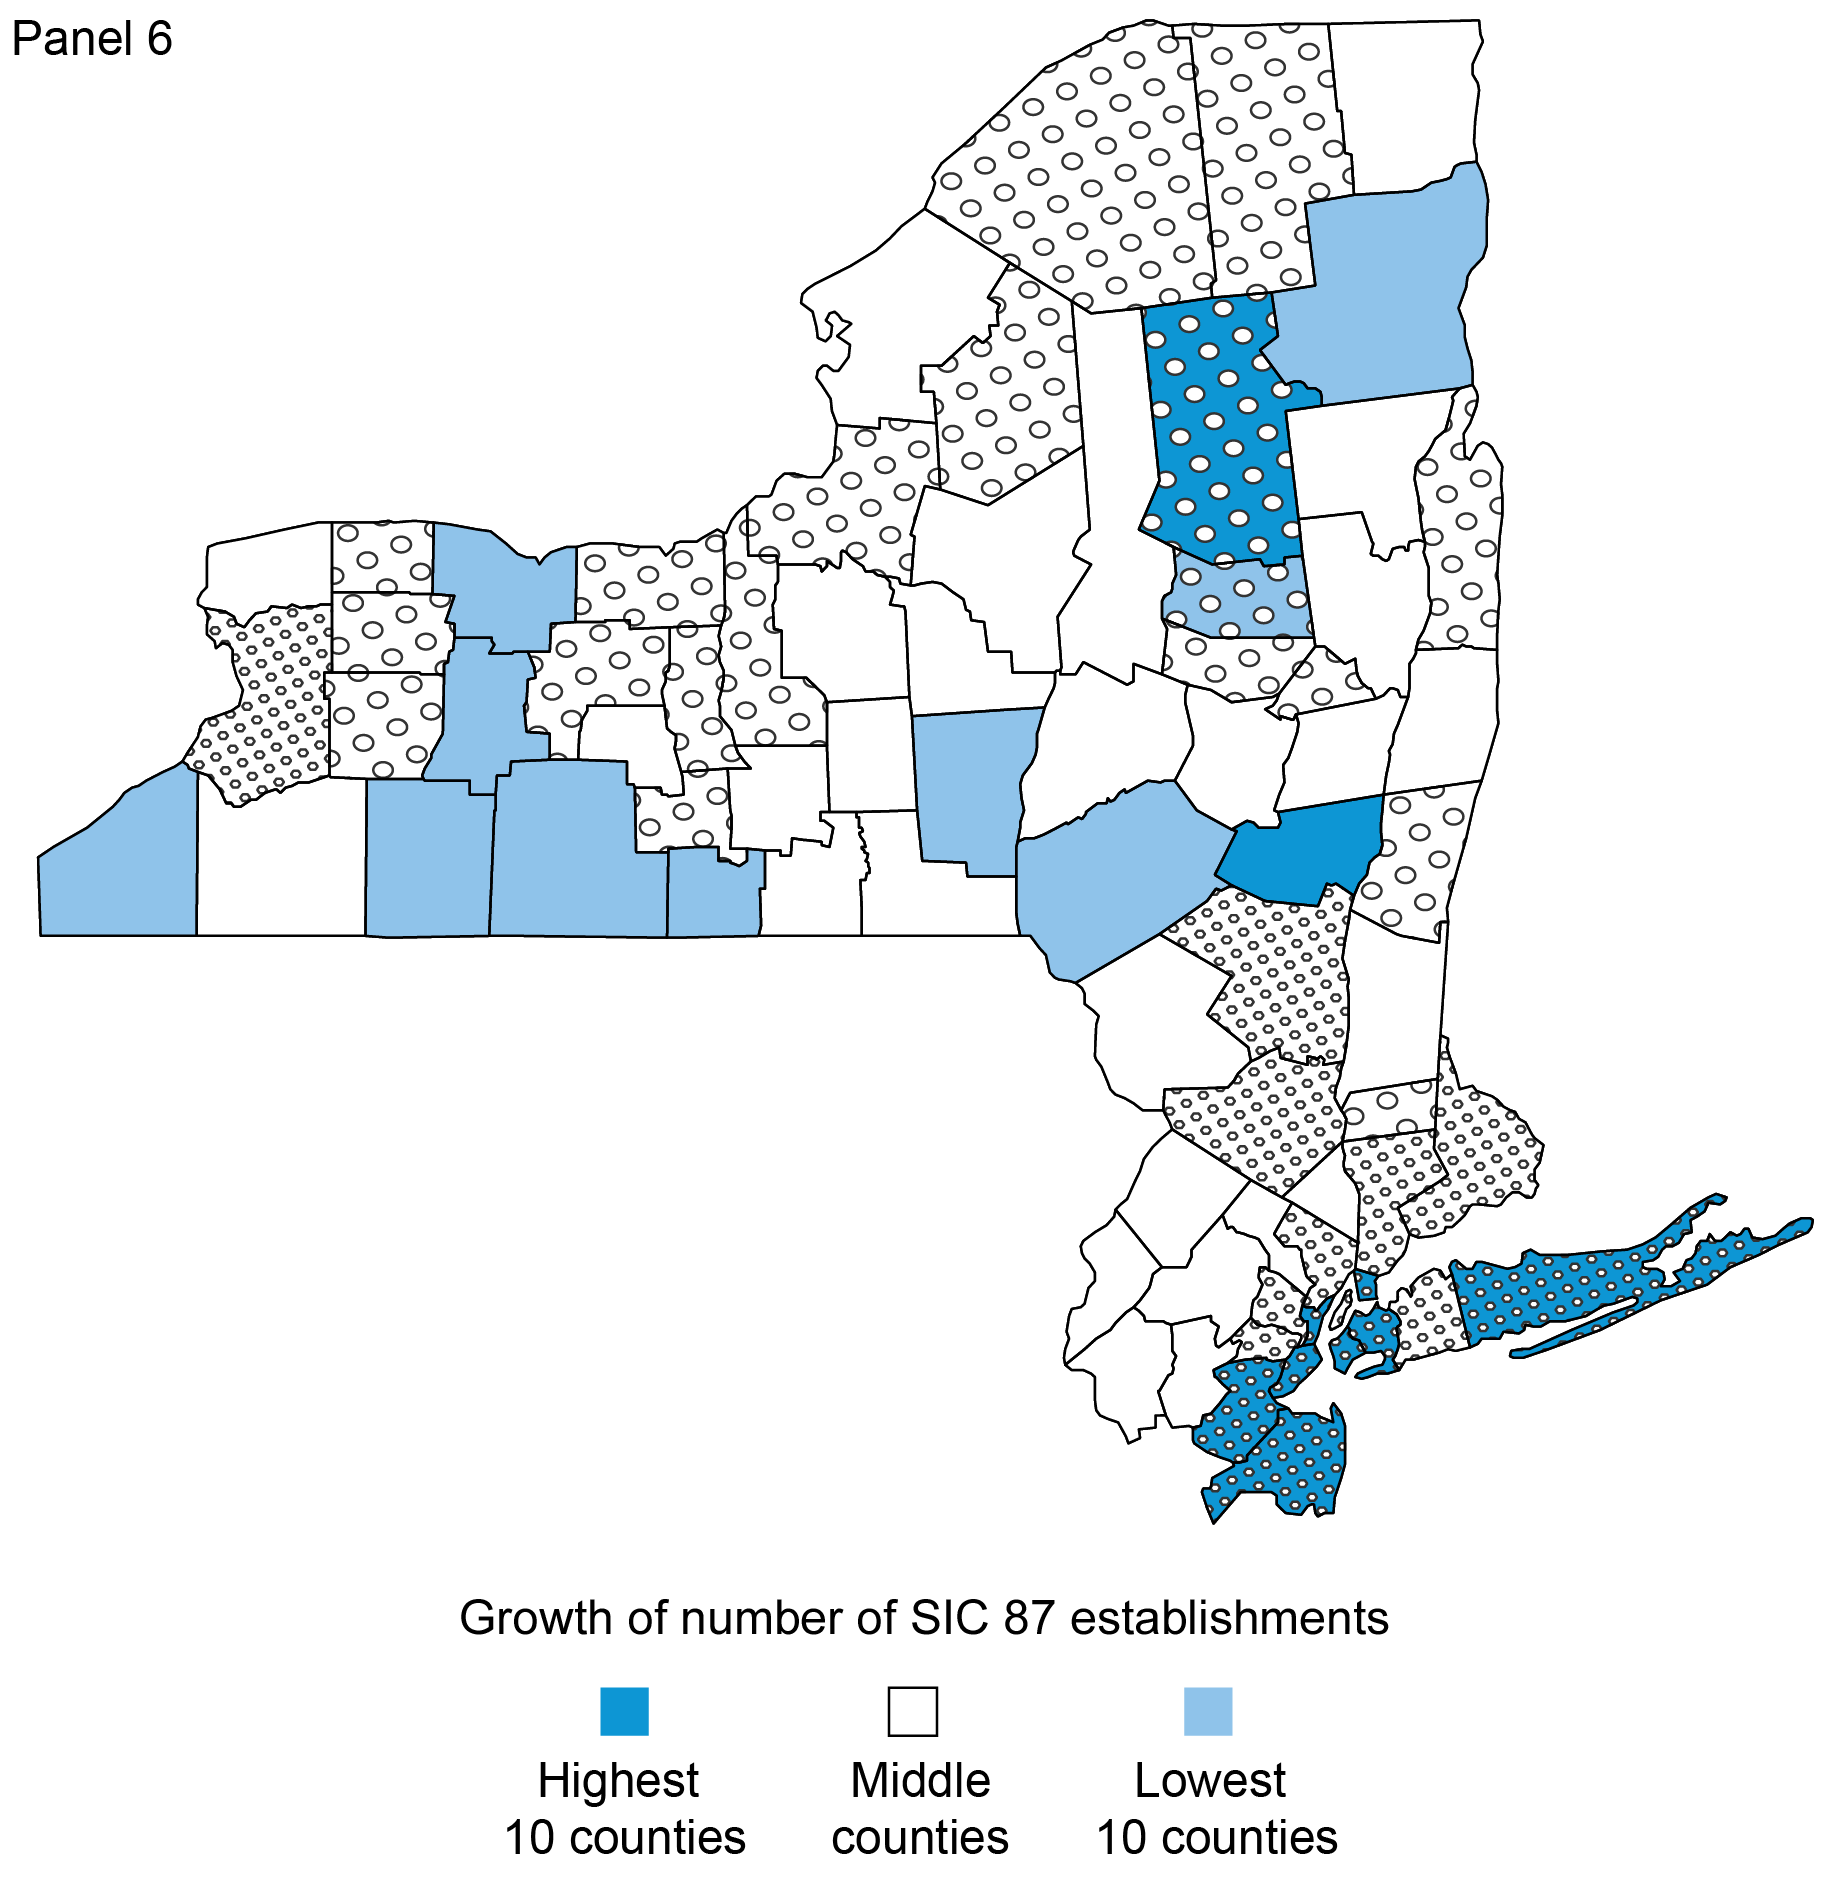
Sources: National Establishment Time Series (NETS); Federal Emergency Management Agency.
Conclusion
In this blog post, we assess potential links between establishments’ location decisions and flood risk in the Second District. Our exploratory analysis highlights that counties with greater exposure to flood risk also tend to be the counties with the highest concentration of establishments. In addition, we do not find evidence that flood risk is deterring the growth of establishments in the Second District, suggesting that counties most exposed to flood risk will continue to play an important role in the region’s economy. The next post in the Extreme Weather series further explores the potential impact of climate change risks on economic activity in the Second District, focusing on the impact of natural disasters on small business owners.

Oliver Zain Hannaoui is a research analyst in the Federal Reserve Bank of New York’s Research and Statistics Group.

Hyeyoon Jung is a financial research economist in Climate Risk Studies in the Federal Reserve Bank of New York’s Research and Statistics Group.

João A.C. Santos is the director of Financial Intermediation Policy Research in the Federal Reserve Bank of New York’s Research and Statistics Group.

Lee Seltzer is a financial research economist in Climate Risk Studies in the Federal Reserve Bank of New York’s Research and Statistics Group.
How to cite this post:
Oliver Zain Hannaoui, Hyeyoon Jung, João A.C. Santos, and Lee Seltzer, “Flood Risk and Firm Location Decisions in the Fed’s Second District,” Federal Reserve Bank of New York Liberty Street Economics, November 14, 2023, https://libertystreeteconomics.newyorkfed.org/2023/11/flood-risk-and-firm-location-decisions-in-the-feds-second-district/
BibTeX: View |
Disclaimer
The views expressed in this post are those of the author(s) and do not necessarily reflect the position of the Federal Reserve Bank of New York or the Federal Reserve System. Any errors or omissions are the responsibility of the author(s).
 RSS Feed
 Follow Liberty Street Economics