


Following the Silicon Valley Bank collapse, the stock prices of U.S banks fell amid concerns about the exposure of the banking sector to interest rate risk. Thus, between March 8 and March 15, 2023, the S&P 500 Bank index dropped 12.8 percent relative to S&P 500 returns (see right panel of the chart below). The stock prices of insurance companies tumbled as well, with the S&P 500 Insurance index losing 6.4 percent relative to S&P 500 returns over the same time interval (see the center panel below). Yet, insurance companies’ direct exposure to the three failed banks (Silicon Valley Bank, Silvergate, and Signature Bank) through debt and equity was modest. In this post, we examine the possible factors behind the reaction of insurance investors to the failure of Silicon Valley Bank.
Stock Price Performance in the Period Surrounding the Collapse of Silicon Valley Bank
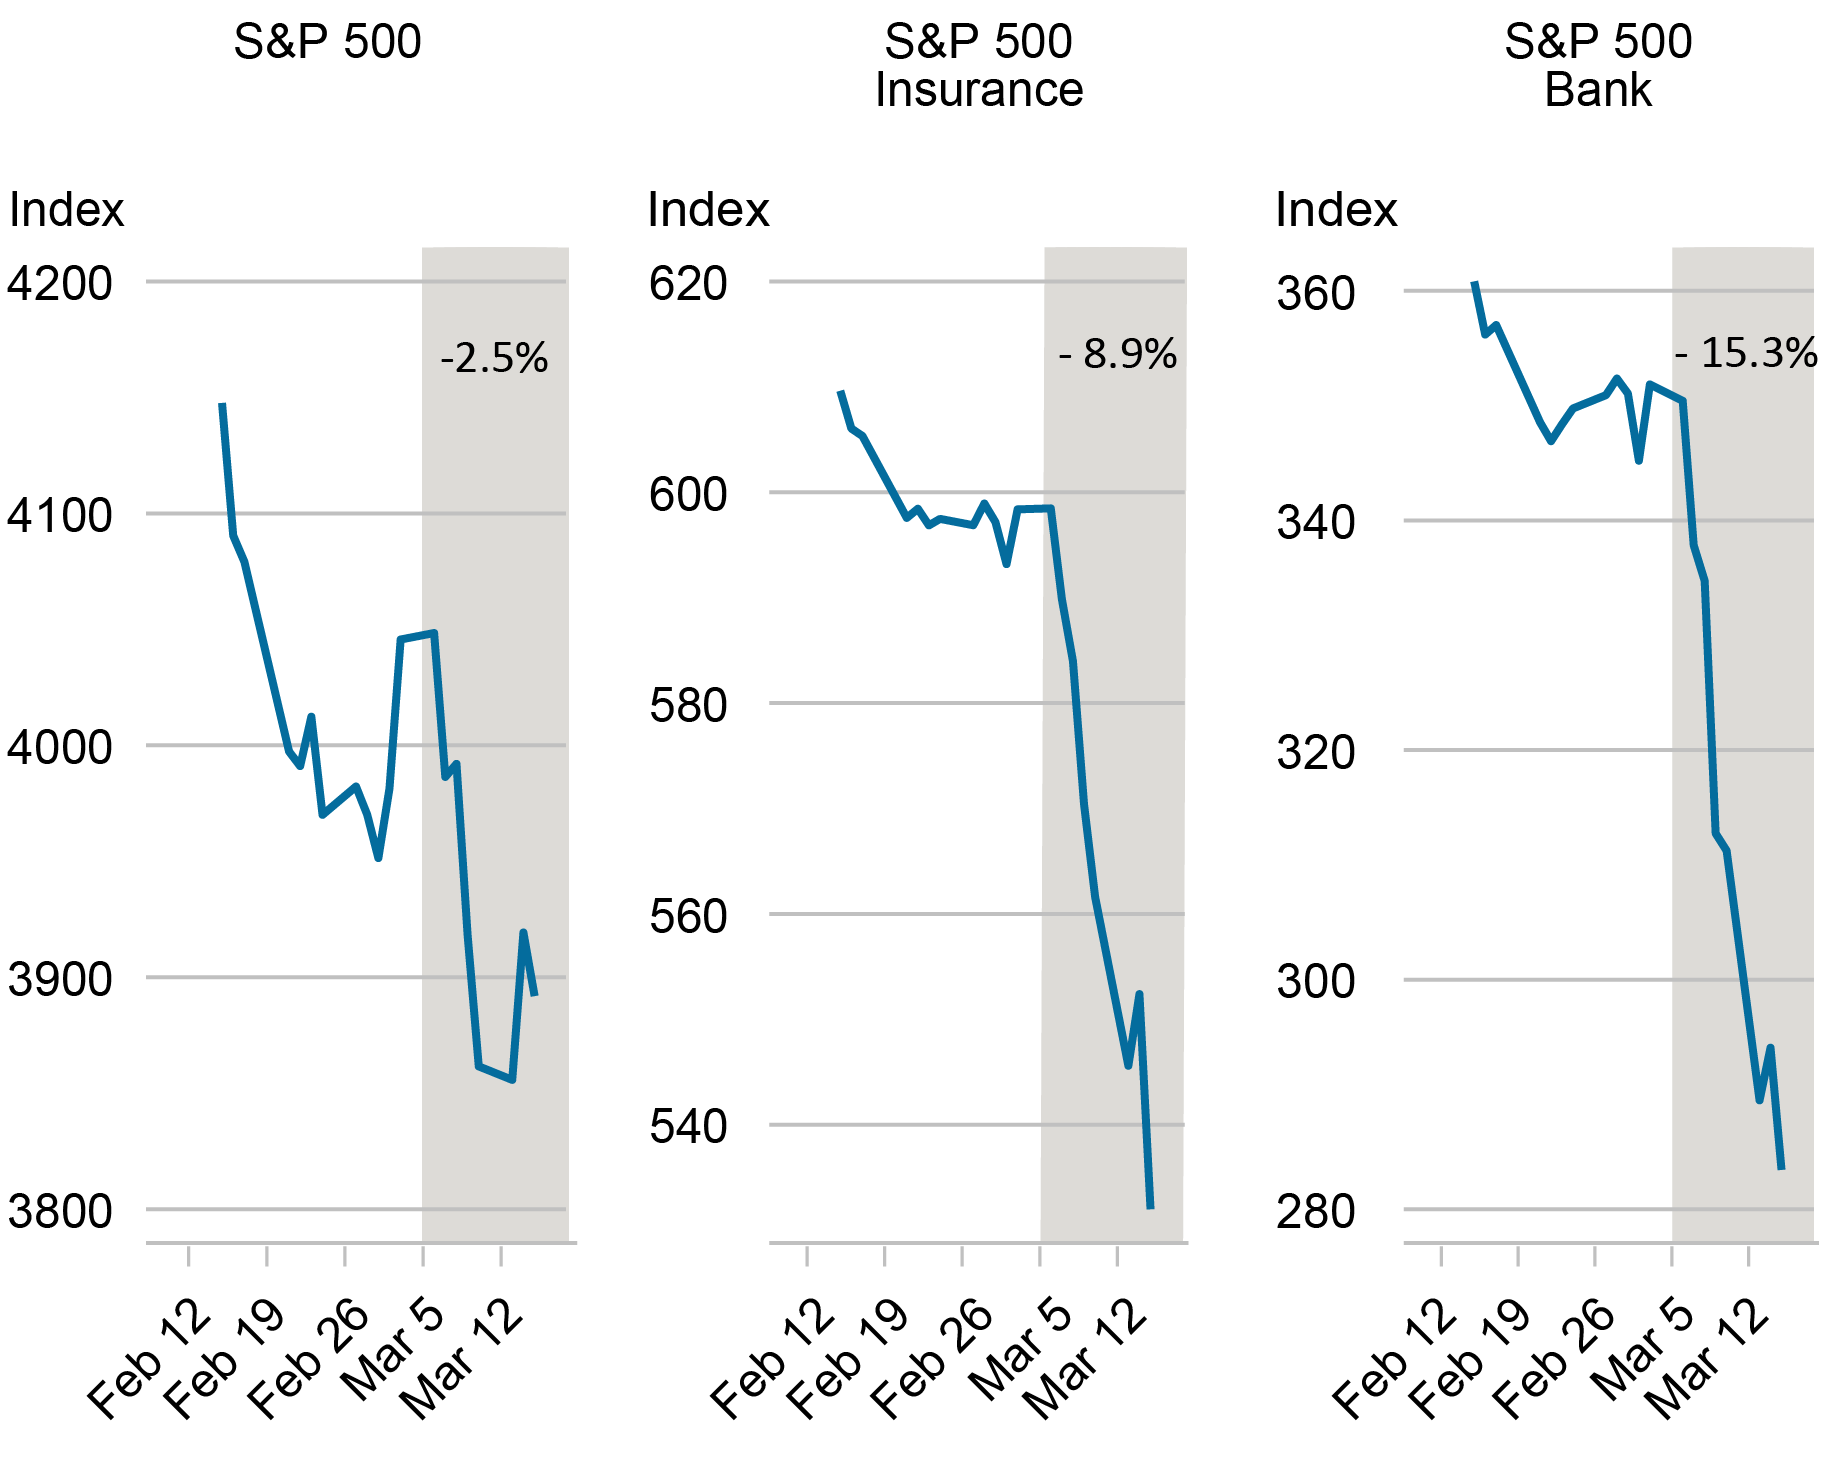
Source: Authors’ calculations based on data from S&P Capital IQ.
Notes: This chart shows the S&P 500 index, S&P 500 Insurance index and S&P 500 Bank index over the time period February 15-March 15, 2023. The shaded area highlights the percentage change in the three indexes from March 8 to March 15 following the Silicon Valley Bank collapse.
Why Did Stock Prices of Insurance Companies Drop after the Failure of Silicon Valley Bank?
A close look at the asset and the liability sides of insurers’ balance sheets provides some insights on their exposure to interest rate risk. Our focus is on the life insurance sector, which accounts for 71 percent of U.S insurance industry assets.
Life insurance companies held $5 trillion in invested assets at the end of 2022. Corporate bonds represented the asset class in which life insurers invested the most, totaling $2 trillion, or 43 percent of invested assets. Mortgages, common stocks, municipal bonds, and government bonds followed next with portfolio shares of 13 percent, 4 percent, 4 percent, and 3 percent, respectively. Life insurance companies invested almost exclusively in investment grade bonds, but 37 percent of bonds in their portfolios are rated BBB, the lowest credit notch within the investment-grade space.
The vast majority (96 percent) of bond investments are reported in the book at cost, with the remaining being reported at fair value. As a result of the interest rate hikes, unrealized losses from marking-to-market bonds that were reported at cost in the statutory filings represented on aggregate 56 percent of total adjusted capital (the numerator of risk-based capital requirements) of life insurance companies in 2022, with significant heterogeneity across insurers. Thus, our first hypothesis is that the size of life insurers’ unrealized losses on bond investments in 2022 relative to total adjusted capital may have played a role in driving insurance investors’ response to the failure of Silicon Valley Bank.
If and the extent to which these losses may be realized depends on different factors including downgrades of securities, policyholders’ surrenders, and losses experienced on the life insurance and annuity business. On the liability-side, long-term insurance policies and annuities represent the most important sources of funding for the life insurance industry. Annuities accounted for 60 percent of total liabilities related to life, annuity, and deposit-type contracts in the general and separate accounts in 2022.
This funding source is considered quite stable given the limits and costs associated with withdrawals (for example, surrender fees and tax penalties). Surrenders are subject to swings and may increase in an environment of rising interest rates, especially in the case of fixed annuities. In 2022, withdrawable liabilities (that is, contracts that allow discretionary withdrawals) accounted for 55 percent of total liabilities related to life, annuity, and deposit type–contracts. We hypothesize that the size of withdrawable liabilities relative to total liabilities could be an additional factor behind insurance investors’ concerns after the failure of Silicon Valley Bank.
In recent years, particular attention has been devoted by academics and policymakers to variable annuities with minimum return guarantees (Drexler et al., 2017; Ellul et al., 2022; Koijen and Yogo, 2022), which represented 39 percent of aggregate reserves for annuity contracts in 2022. These consist of saving products where the funds contributed by policyholders are allocated to subaccounts invested in assets and a minimum growth rate in the annuity balance is guaranteed. Since variable annuities balances are mostly invested in stocks, insurers’ liability associated with guaranteed variable annuities increases not only if interest rates decline, but also if the stock market drops. If the returns generated by the investments are not enough to satisfy the guarantees, life insurers face a loss and may need to fund the guarantees by selling assets in their general account. Thus, we hypothesize that the size of variable annuities with minimum guarantees to total liabilities could be a third factor explaining investors’ response to the failure of Silicon Valley Bank.
The Stock Returns of Life Insurers around the Silicon Valley Bank Event Correlate with Their Unrealized Losses and Liability Conditions
To test our hypotheses, we collect stock prices and balance sheet data on twenty-nine U.S. insurance groups primarily engaged in the life insurance business (henceforth abridged “life insurance firms”). For each firm, we calculate the following three metrics: i) unrealized losses on bonds issued by unaffiliated entities and reported at cost as a percentage of total adjusted capital, ii) withdrawable liabilities as a percentage of total liabilities related to life, annuity, and deposit type-contracts, and iii) guaranteed variable annuity reserves as a percentage of total liabilities related to life, annuity, and deposit type-contracts. Although these metrics exhibit a positive pairwise correlation, they should nevertheless capture different dimensions of risk to some extent. Next, we construct a set of size-weighted portfolios of these publicly listed firms based on whether each of the three metrics is above or below its median in 2022 and then calculate the cumulative stock returns for each portfolio over the time period March 7 to March 15, 2023.
Cumulative Stock Returns of Life Insurers around the Silicon Valley Bank Collapse by Sub-groups based on Unrealized Losses and Liability Conditions
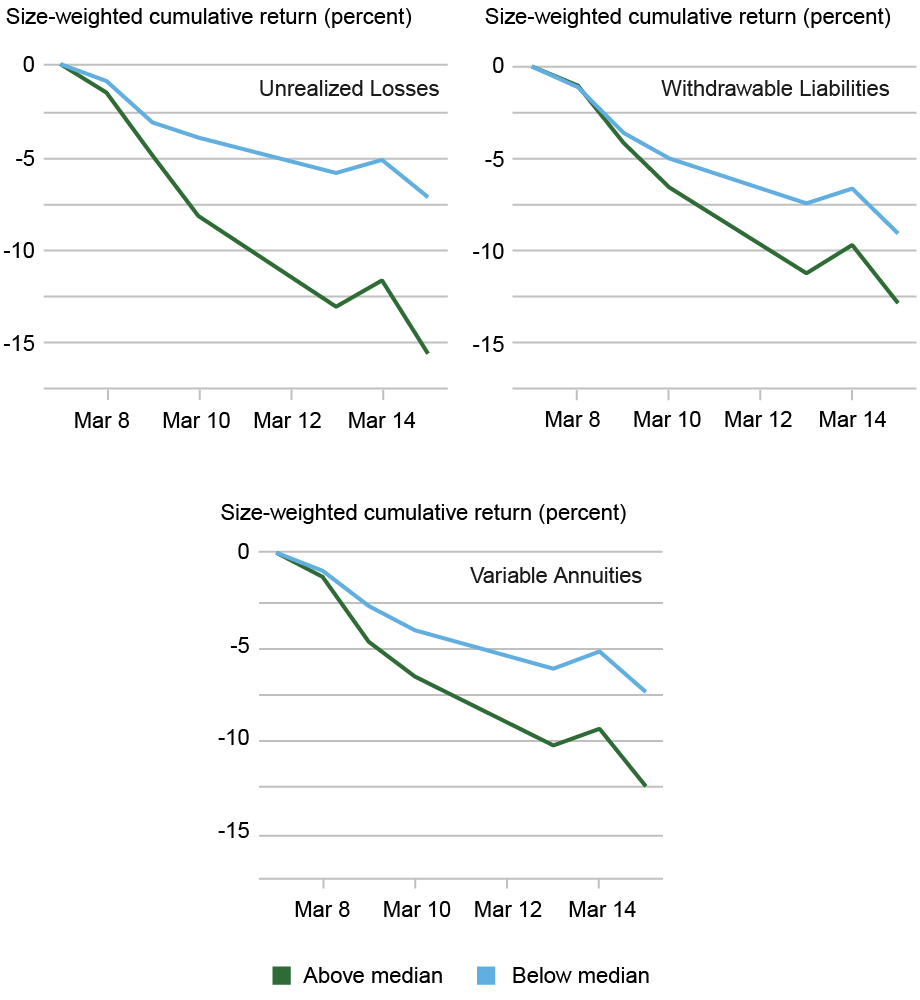
Notes: This chart shows cumulative stock returns over the time period March 7 to March 15, 2023, for different size-weighted portfolios of publicly listed life insurance firms. We construct each portfolio by splitting the sample based on firms above and below the 2022 median of the following metrics: i) unrealized losses on investments in bonds issued by unaffiliated entities and reported at cost as a percentage of total adjusted capital, ii) withdrawable liabilities as a percentage of total liabilities related to life, annuity, and deposit type-contracts, and iii) guaranteed variable annuity reserves as a percentage of total liabilities related to life, annuity, and deposit type-contracts.
The three plots presented in the chart above provide empirical evidence that is consistent with our hypotheses. In particular, insurance firms with unrealized losses exposure, withdrawable liability exposure, and variable annuity exposure above the median experienced negative cumulative returns that are 8 percent, 4 percent, and 5 percent lower than below-median firms, respectively. Our result for the variable annuity exposure is consistent with Ellul et al. (2022) and Koijen and Yogo (2022), who document that life insurance firms with large guaranteed variable annuity business exhibited a worse stock performance than the insurance industry during the global financial crisis and the COVID-19 pandemic. Overall, the negative performance of life insurance stocks amid the failure of Silicon Valley Bank exhibits the strongest relation with the size of unrealized losses relative to total adjusted capital.
Sensitivity of Life Insurance Companies’ Stock Returns to Bond Returns
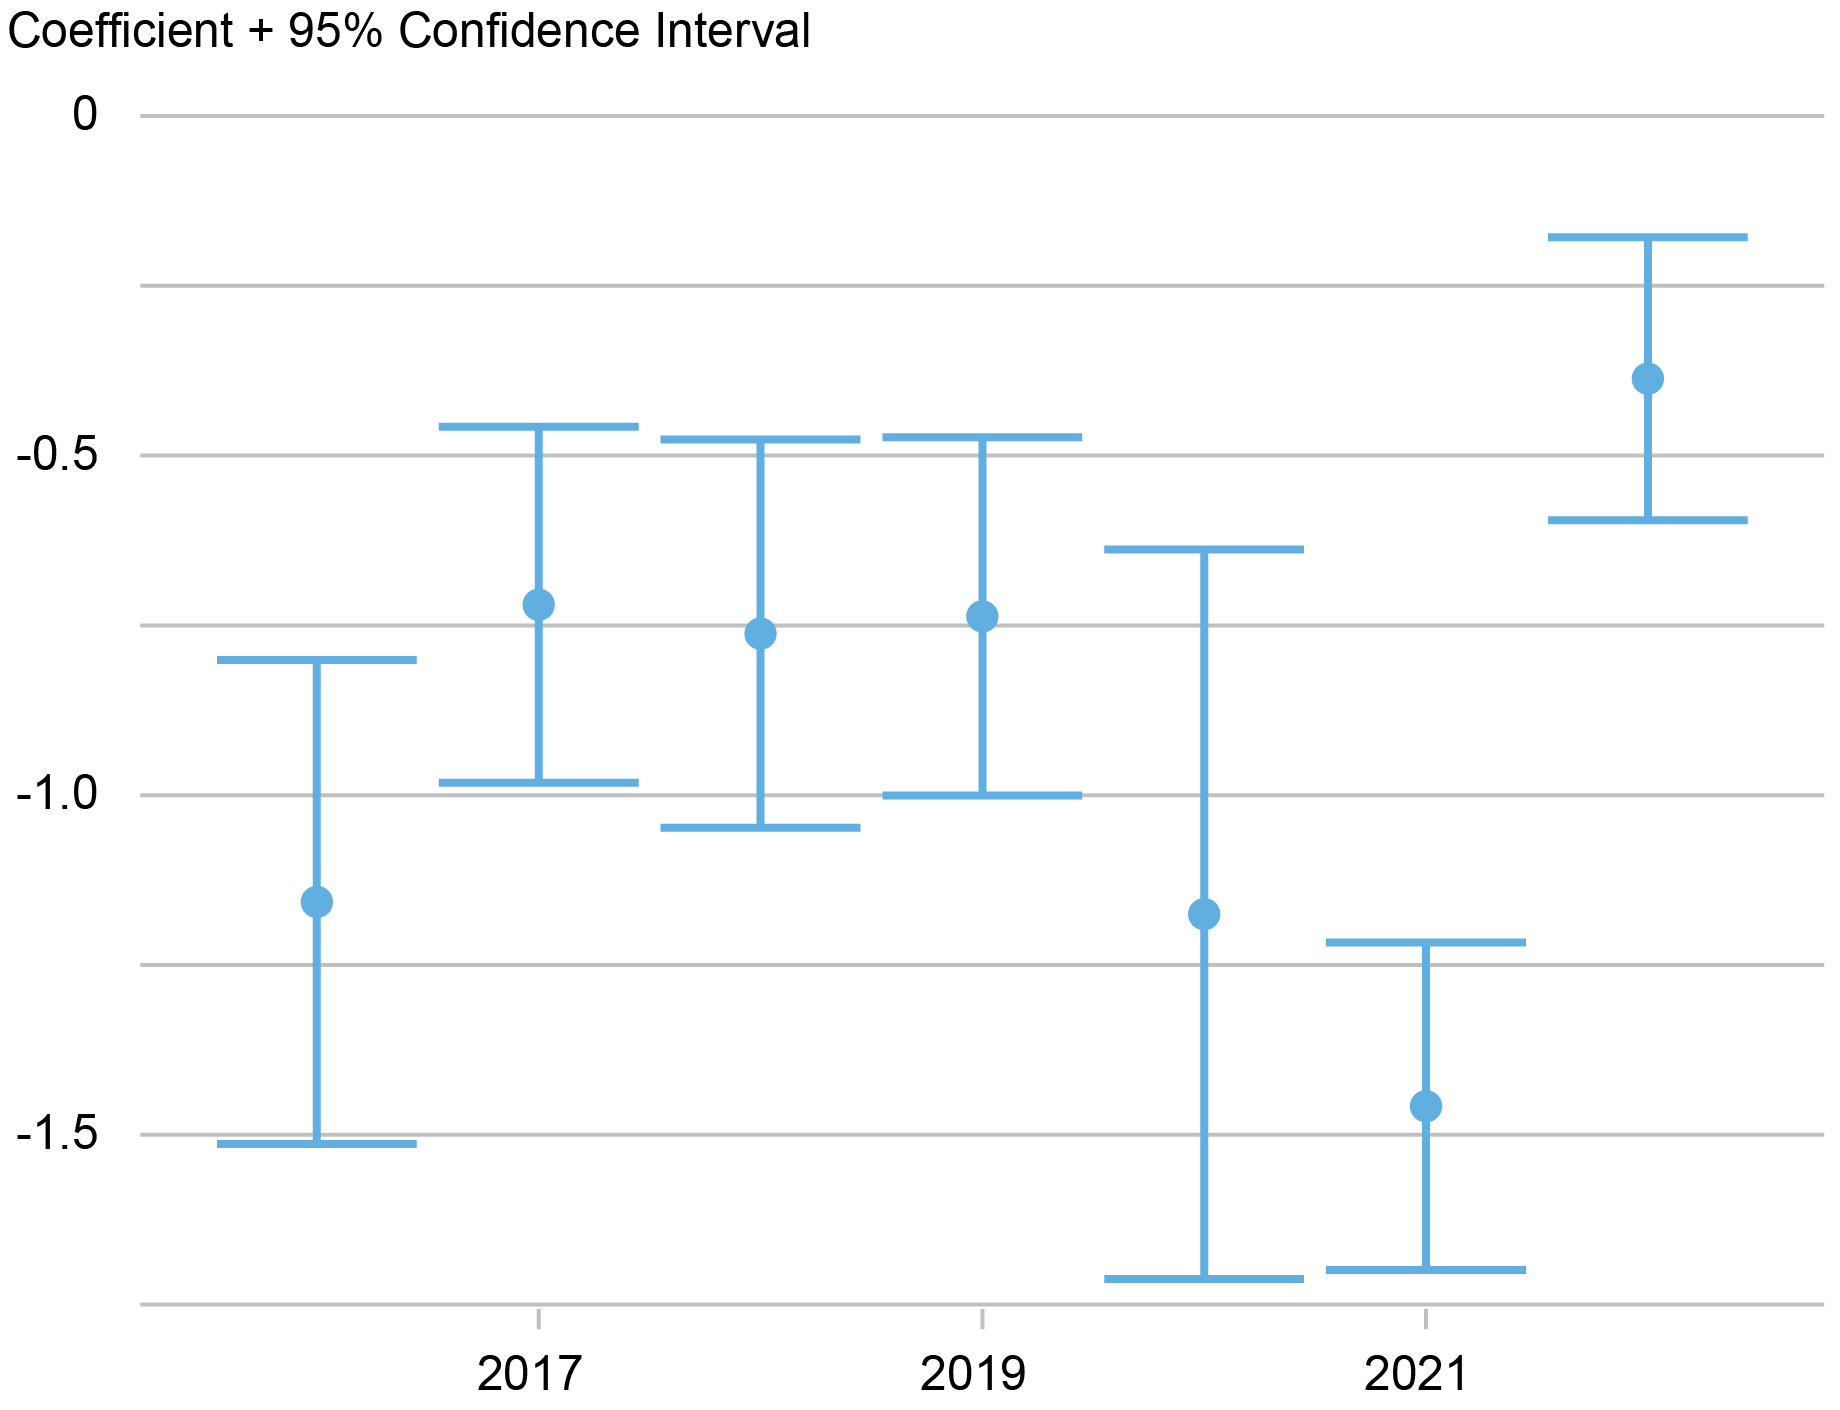
Notes: This chart reports the estimates of the coefficient of the two-factor model, as in Brewer, Mondschean, and Strahan (1993) and Berends et al. (2013), capturing the sensitivity of life insurers’ stock returns to bond returns. In the two-factor model, we regress the daily stock returns of a set of twenty-nine life insurance firms on the CRSP value-weighted market index and the holding return of a ten-year Treasury bond. We estimate the model within non-overlapping rolling windows of one year.
Sensitivity of Life Insurers’ Stocks Returns to Interest Rates
How did the overall exposure of life insurance firms to interest rate risk evolve following the interest rate hikes of 2022? To address this question, we estimate the sensitivity of life insurance stock returns to changes in interest rates relying on a two-factor model as in Brewer, Mondschean, and Strahan (1993) and Berends et al. (2013). The above chart reports the estimates for each year of the coefficient capturing the sensitivity of life insurers’ stock returns to the return on a ten-year Treasury bond. During the 2016-22 period, the response of life insurers’ stock returns to bond returns is negative, consistent with a negative duration gap (that is, liabilities having a longer duration than assets). The upward jump in the estimated coefficient between 2021 and 2022 is consistent with a shortening of liabilities compared to assets (for example, because surrenders are more likely) following the interest rate hikes of 2022. The worse stock performance of insurance firms with larger unrealized losses exposure and withdrawable liability exposure after the failure of Silicon Valley Bank is in line with this market-implied shift in insurers’ exposure to interest rate risk.

Fulvia Fringuellotti is a financial research economist in Non-Bank Financial Institution Studies in the Federal Reserve Bank of New York’s Research and Statistics Group.

Sakteh Prazad is a senior research analyst in the Federal Reserve Bank of New York’s Research and Statistics Group.
How to cite this post:
Fulvia Fringuellotti and Saketh Prazad, “A Retrospective on the Life Insurance Sector after the Failure of Silicon Valley Bank,” Federal Reserve Bank of New York Liberty Street Economics, April 10, 2024, https://libertystreeteconomics.newyorkfed.org/2024/04/a-retrospective-on-the-life-insurance-sector-after-the-failure-of-silicon-valley-bank/
BibTeX: View |


Disclaimer
The views expressed in this post are those of the author(s) and do not necessarily reflect the position of the Federal Reserve Bank of New York or the Federal Reserve System. Any errors or omissions are the responsibility of the author(s).
 RSS Feed
 Follow Liberty Street Economics