


Disparities in wealth are pronounced across racial and ethnic groups in the United States. As part of an ongoing series on inequality and equitable growth, we have been documenting the evolution of these gaps between Black, Hispanic, and white households, in this case from the first quarter of 2019 to the fourth quarter of 2023 for a variety of assets and liabilities for a pandemic-era picture. We find that real wealth grew and that the pace of growth for Black, Hispanic, and white households was very similar across this timeframe—yet gaps across groups persist.
Data Sources
For this analysis, we rely on the quarterly demographic wealth distributions published in the Federal Reserve Board’s Distributional Financial Accounts (DFA), which are estimated using microdata from the Survey of Consumer Finances (SCF), and aggregate financial data from the Fed’s Financial Accounts series. Due to sample size concerns, we have omitted Asian and Pacific Islander households and households from smaller groups. Hereafter, references to the “study population” refer to Hispanic, non-Hispanic Black, and non-Hispanic white households. We define wealth as net worth (assets minus liabilities).
We had previously written on racial and ethnic differences in wealth in a February 2024 blog post (as well as differences by age) and found a decline in the aggregate real wealth of Black households after 2019. However, some questions about the data, related to the sample of Black households, came to our attention after that post and we decided to revisit the analysis at the household level rather than the aggregate level.
At the beginning of 2019, Hispanic and Black households constituted 11 percent and 16 percent of households in the study population, respectively, yet they held just 2.7 percent and 4.9 percent of total wealth of that population. Meanwhile, 73 percent of households in our sample were white and held 92.4 percent of the wealth. In 2019 dollars, the average Black household held $253,000 in wealth, the average Hispanic household held $205,000, and the average white household held $1.06 million. The data allow us to calculate wealth estimates for average households by group but not for median households, so we report only averages.
Real Wealth Grew Across Groups
We find that growth in real wealth per household was substantial and very similar across Black, Hispanic, and white households over the 2019-23 period. We calculate real wealth growth in 2019 dollars using the race/ethnicity-specific price indices presented in the inflation inequality section of the Equitable Growth Indicators (EGIs) series. The chart below shows that cumulative growth in the real wealth of white households since 2019 marginally outpaced growth in the real wealth of Black and Hispanic households. The cumulative growth in average real wealth between 2019:Q1 and 2023:Q4 was 26 percent for white households, 24 percent for Black households, and 22 percent for Hispanic households.
Real Average Household Wealth Growth Since the Pandemic Was Similar Across Racial and Ethnic Groups
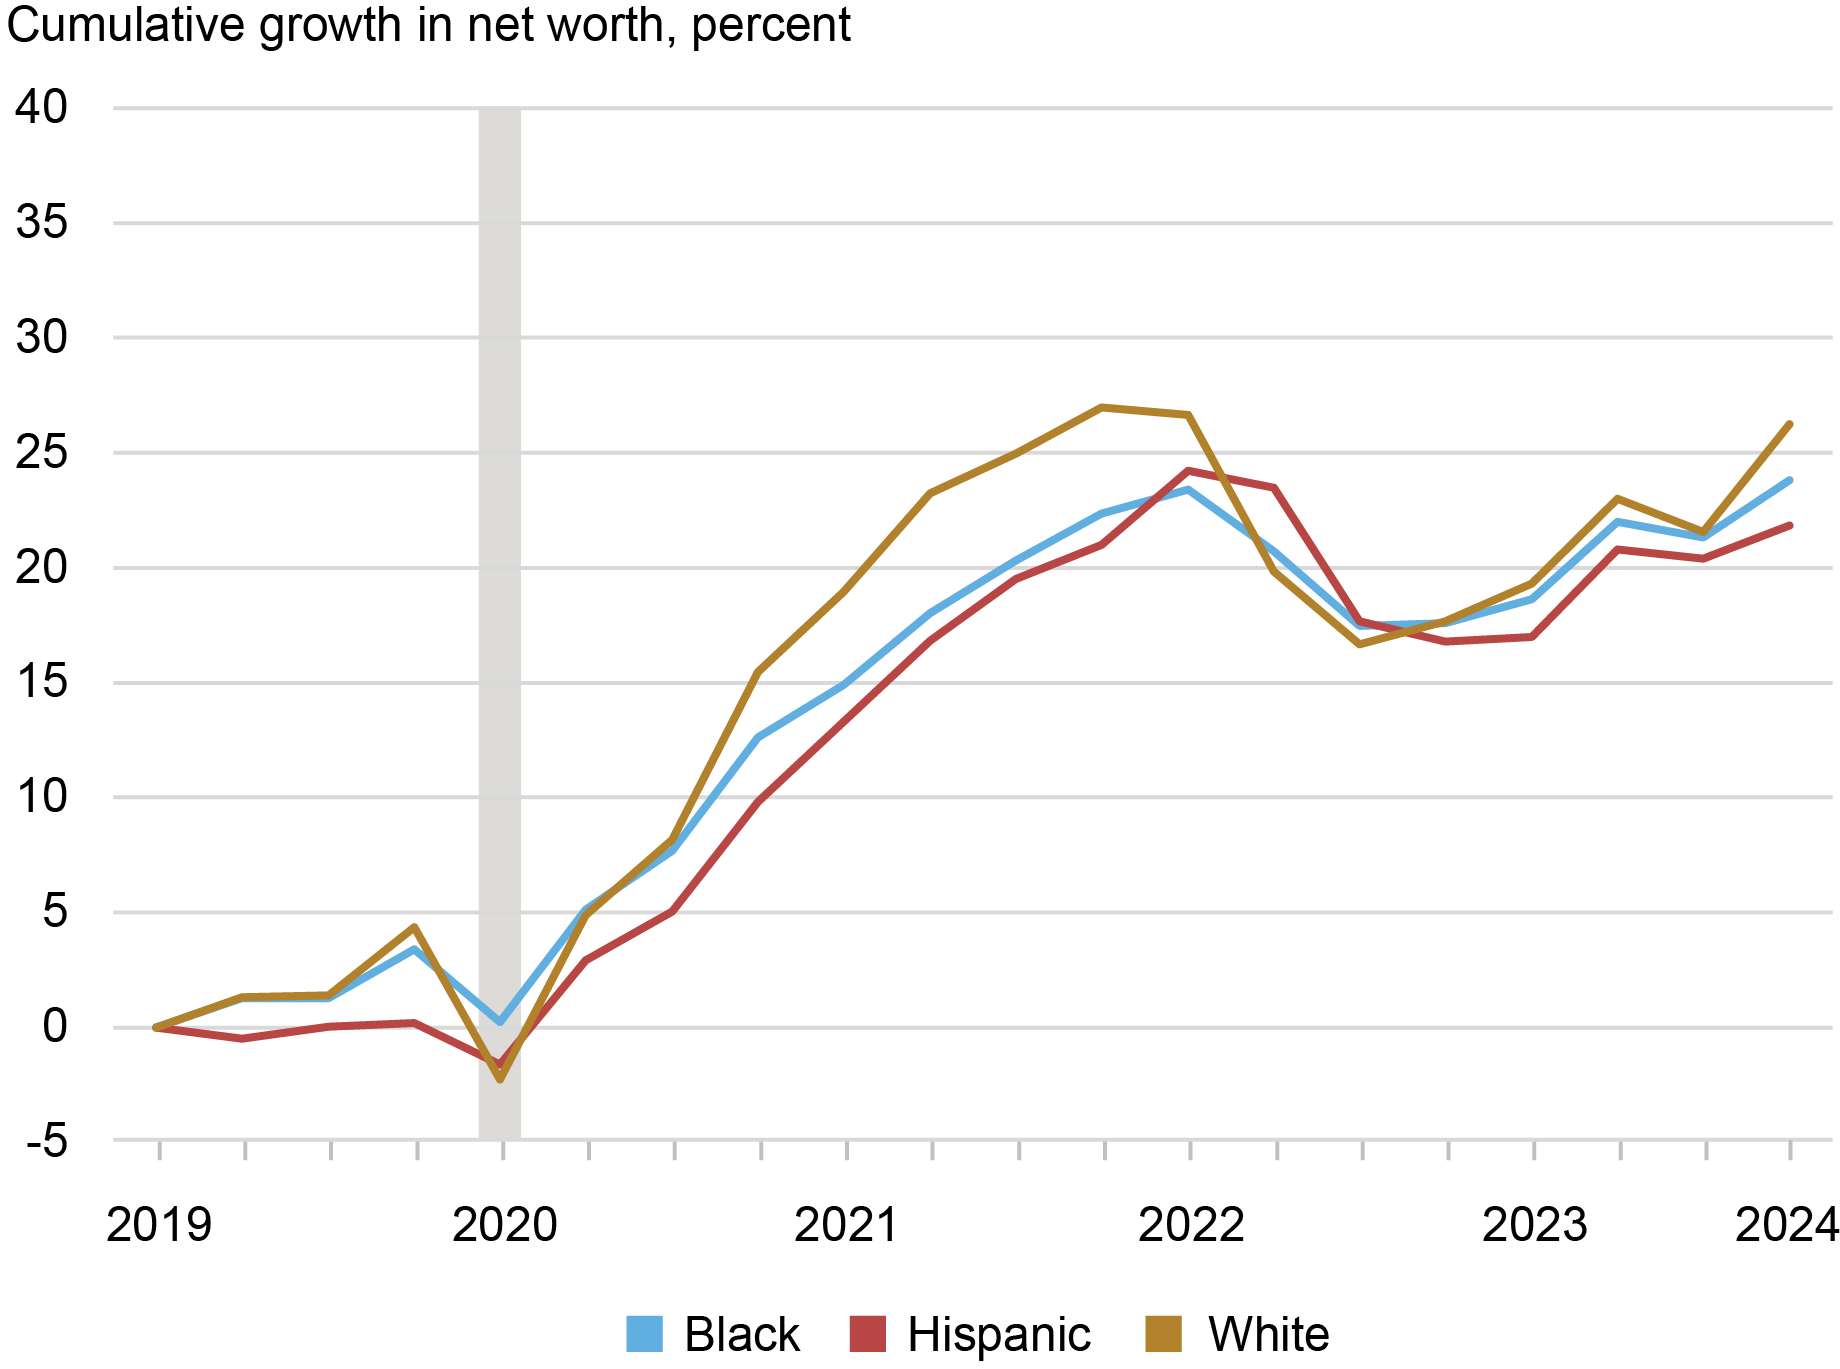
Note: Asian, American Indian, Pacific Islander, and other groups are excluded for sample size concerns.
Similar changes in wealth across racial and ethnic groups hide underlying differences in asset growth rates and the types of assets favored across groups. Black, Hispanic, and white households invest their total assets in financial and real estate assets at different rates: in total, assets held by white households in 2019:Q1 were about 73 percent financial and 23 percent real estate, Black household assets were about 67 percent financial and 26 percent real estate, and total Hispanic assets were 51 percent financial and 39 percent real estate. The remaining assets are held in consumer durables and cash deposits.
Growth by Asset Type
Financial asset prices rose sharply over our study period and did not decline significantly after policy rate hikes during this time. Real financial assets held by white households grew by 21 percent from 2019:Q1 to 2023:Q4, outpacing real financial asset growth of Black and Hispanic households by 13 and 18 percentage points, respectively (see chart below). Real financial wealth for the average Hispanic household had declined relative to 2019:Q1 as of the third quarter of 2023 but recovered to achieve cumulative growth of 2 percent by 2023:Q4. Importantly, growth in the value of households’ holdings of an asset type is influenced by both changes in asset prices and changes in households’ investment decisions. Meanwhile, household decisions were potentially shaped in response to greater disposable incomes granted by pandemic transfers. However, the data do not allow us to distinguish between these factors. The different real growth rates estimated across these groups are also influenced by our use of demographic price deflators, but the observed disparities are just as pronounced in nominal terms, as seen in our wealth Equitable Growth Indicators where we present both nominal and real wealth. Households also hold different asset and liabilities within the broad categories we address here and those differences can also cause differential growth rates. A full set of differential wealth growth charts are available in both nominal and real terms by racial and ethnic groups, age groups, education groups, income percentiles, and wealth percentiles on our EGIs site.
White Households Led Financial Asset Growth While Black Households Led Real Estate Growth
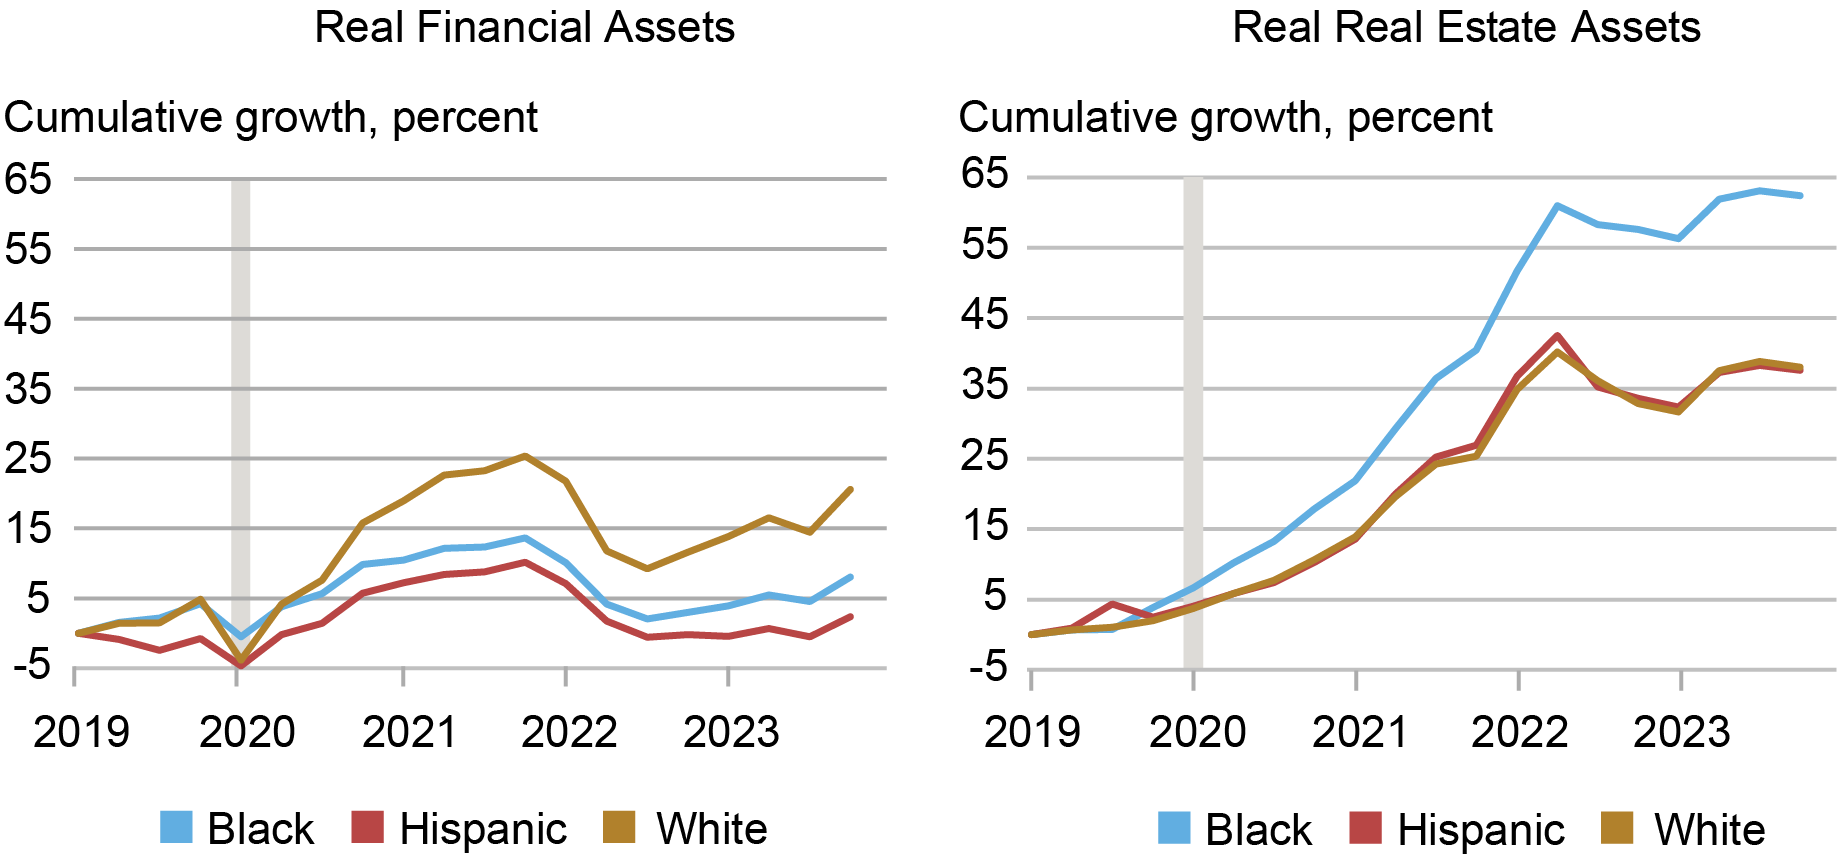
Note: Asian, American Indian, Pacific Islander, and other groups are excluded for sample size concerns.
Meanwhile, the real estate wealth of the average Black household grew by 62 percent, 24 percentage points above the 38 percent real estate growth captured by both white and Hispanic households. While Black households led real estate asset growth by a significant margin, Black households also saw rapid growth in mortgage and consumer credit liabilities and therefore experienced similar growth in net wealth to white and Hispanic households. Since 62 percent by far exceeded average home price increases during this period, some of the increase in real estate wealth is likely owing to increases in homeownership of Black households. Below we explore the reasons behind differential growth in financial assets across groups.
The chart below depicts the financial asset classes each racial group held in 2019:Q1 and 2023:Q4. All three groups allocate similar shares of their financial asset portfolios to “other assets” (composed of insurance payouts, mortgage assets, and other small, miscellaneous assets), but exhibit differences across the other categories. More than 60 percent of Black households’ financial wealth is in pensions (which includes both defined benefit and defined contribution pensions) and less than 20 percent is invested in private businesses, corporate equities, and mutual funds. Meanwhile less than 30 percent of white households’ financial wealth is invested in pensions and almost 50 percent is in businesses, equities, and mutual funds. Hispanic households’ financial asset allocations are like those of Black households but with slightly more investment in businesses, equities, and mutual funds and slightly less in pensions. White households had the most exposure to businesses, equities, and mutual funds and experienced much faster financial asset growth since 2019:Q1 as much of the period was associated with substantive appreciation of these specific assets.
Financial Asset Portfolios Differ Starkly by Race
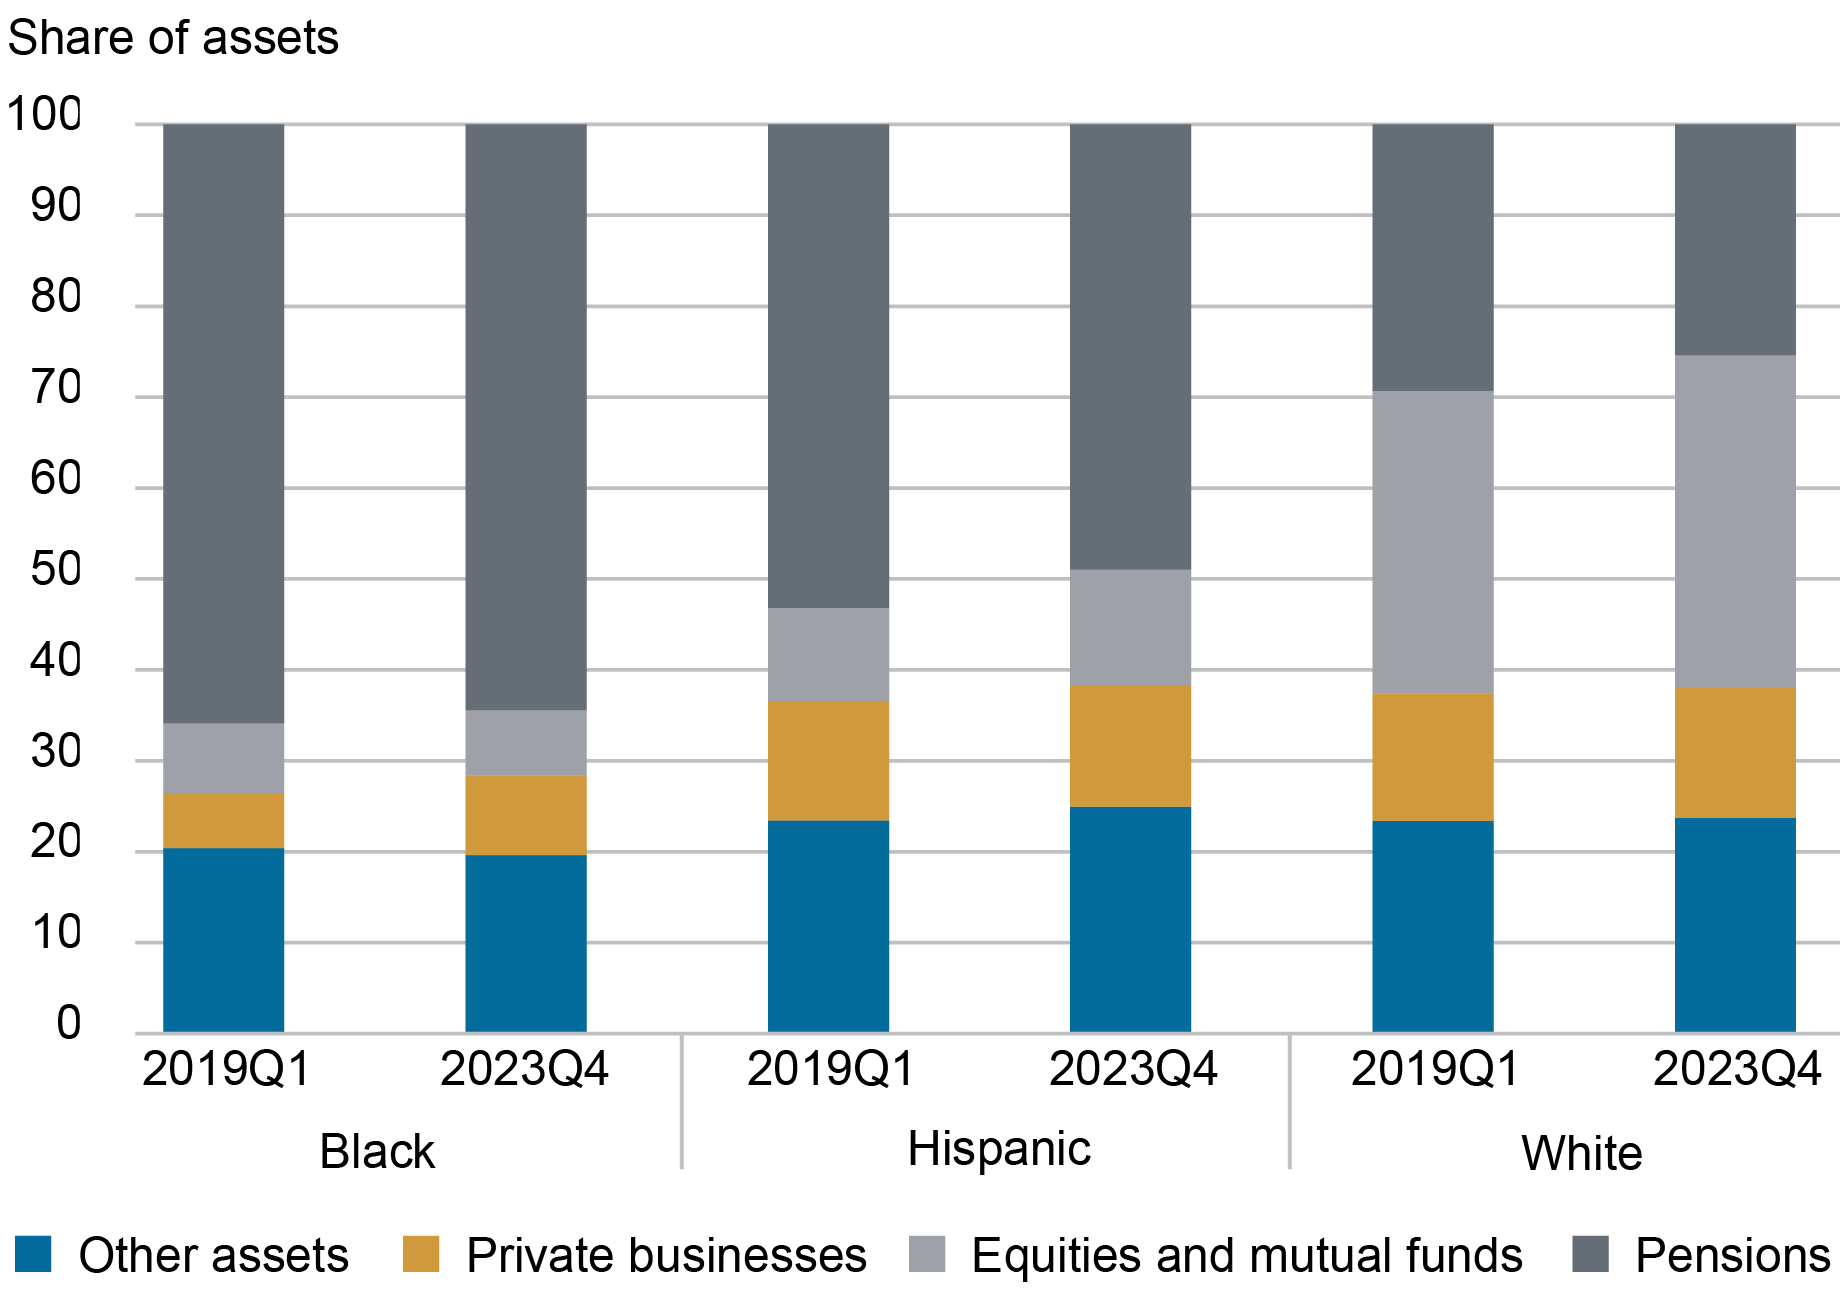
Note: “Net worth” is total assets less total liabilities.
To conclude, the real wealth of Black, Hispanic, and white households grew at similar rates since the onset of the pandemic and the wealth gaps seen in the pre-pandemic period persist. We will continue to monitor changes in the wealth distribution as monetary policy and the economic environment evolves.

Rajashri Chakrabarti is the head of Equitable Growth Studies in the Federal Reserve Bank of New York’s Research and Statistics Group.

Natalia Emanuel is a research economist in Equitable Growth Studies in the Federal Reserve Bank of New York’s Research and Statistics Group.

Ben Lahey is a former research analyst in the Federal Reserve Bank of New York’s Research and Statistics Group.
How to cite this post:
Rajashri Chakrabarti, Natalia Emanuel, and Ben Lahey , “Racial and Ethnic Inequalities in Household Wealth Persist ,” Federal Reserve Bank of New York Liberty Street Economics, June 28, 2024, https://libertystreeteconomics.newyorkfed.org/2024/06/racial-and-ethnic-inequalities-in-household-wealth-persist/
BibTeX: View |


Disclaimer
The views expressed in this post are those of the author(s) and do not necessarily reflect the position of the Federal Reserve Bank of New York or the Federal Reserve System. Any errors or omissions are the responsibility of the author(s).
 RSS Feed
 Follow Liberty Street Economics