


This post presents an update of the economic forecasts generated by the Federal Reserve Bank of New York’s dynamic stochastic general equilibrium (DSGE) model. We describe very briefly our forecast and its change since March 2024. As usual, we wish to remind our readers that the DSGE model forecast is not an official New York Fed forecast, but only an input to the Research staff’s overall forecasting process. For more information about the model and variables discussed here, see our DSGE model Q & A.
The New York Fed model forecasts use data released through 2024:Q1, augmented for 2024:Q2 with the median forecasts for real GDP growth and core PCE inflation from the May release of the Philadelphia Fed Survey of Professional Forecasters (SPF), as well as the yields on 10-year Treasury securities and Baa-rated corporate bonds based on 2024:Q2 averages up to May 17. Starting in 2021:Q4, the expected federal funds rate (FFR) between one and six quarters into the future is restricted to equal the corresponding median point forecast from the latest available Survey of Primary Dealers (SPD) in the corresponding quarter. For the current projection, this is the May SPD.
The data in 2024:Q1 contained mostly negative surprises for the model: inflation was as much as 1.5 percentage points higher on an annualized basis than the model had predicted in March, while output growth was about 0.5 percentage point lower, also on an annualized basis. Monetary policy became more restrictive than anticipated in March, and productivity surprised on the upside. As a result of these developments, the model’s forecasts changed considerably, especially for 2024. Core PCE inflation is expected to be significantly higher over the current year (2.7 percent versus 2.0 percent in March) and output growth nearly 1 percentage point lower (1.0 percent versus 1.9 percent in March). The model mainly attributes the forecasted rise in inflation to cost-push shocks, which also exert a negative impact on output growth. The other factor pushing forecasts of economic activity down, especially in the second half of 2024, is the more contractionary stance of monetary policy, as evinced by the large change in SPD projections between January and May. While the short-run real natural rate of interest (r*) is also projected to be 0.4 percentage point higher at the end 2024 relative to the March forecast, the model sees policy as being restrictive throughout the forecast horizon, with the expected real rate of interest above its natural counterpart. As a result of both the decline in economic activity and the productivity-induced rise in potential output, the output gap is projected to fall into negative territory by the end of the year. As a note of caution, two years ago the model had predicted that policy tightening would have a significant impact on economic activity and result in a mild recession. This did not occur, and the model may well be wrong again.
Projections for the remainder of the forecast horizon are stronger for output growth (0.9, 1.1, and 1.9 percent in 2025, 2026, and 2027 versus 0.7, 0.5, and 1.0 percent in March, respectively) and the natural rate of interest (2.2, 1.9, and 1.6 percent in 2025, 2026, and 2027 versus 1.9, 1.6, and 1.4 percent in March, respectively) and lower for inflation (1.7, 1.6, and 1.6 percent in 2025, 2026, and 2027 versus 2.0, 2.1, and 2.2 percent in March, respectively). All these changes in longer-run projections are mostly due to higher expected future TFP growth.
Forecast Comparison
| Forecast Period | 2024 | 2025 | 2026 | 2027 | ||||
|---|---|---|---|---|---|---|---|---|
| Date of Forecast | Jun 24 | Mar 24 | Jun 24 | Mar 24 | Jun 24 | Mar 24 | Jun 24 | Mar 24 |
| GDP growth (Q4/Q4) | 1.0 (-2.1, 4.0) | 1.9 (-2.2, 6.1) | 0.9 (-4.2, 6.2) | 0.7 (-4.3, 5.6) | 1.1 (-4.1, 6.4) | 0.5 (-4.7, 5.8) | 1.9 (-3.7, 7.5) | 1.0 (-4.6, 6.5) |
| Core PCE inflation (Q4/Q4) | 2.7 (2.3, 3.1) | 2.0 (1.5, 2.6) | 1.7 (0.9, 2.5) | 2.0 (1.1, 2.8) | 1.6 (0.6, 2.5) | 2.1 (1.1, 3.0) | 1.6 (0.6, 2.7) | 2.2 (1.1, 3.3) |
| Real natural rate of interest (Q4) | 2.5 (1.2, 3.7) | 2.1 (0.8, 3.4) | 2.2 (0.8, 3.7) | 1.9 (0.4, 3.3) | 1.9 (0.3, 3.5) | 1.6 (0.0, 3.2) | 1.6 (-0.1, 3.3) | 1.4 (-0.3, 3.1) |
Notes: This table lists the forecasts of output growth, core PCE inflation, and the real natural rate of interest from the June 2024 and March 2024 forecasts. The numbers outside parentheses are the mean forecasts, and the numbers in parentheses are the 68 percent bands.
Forecasts of Output Growth
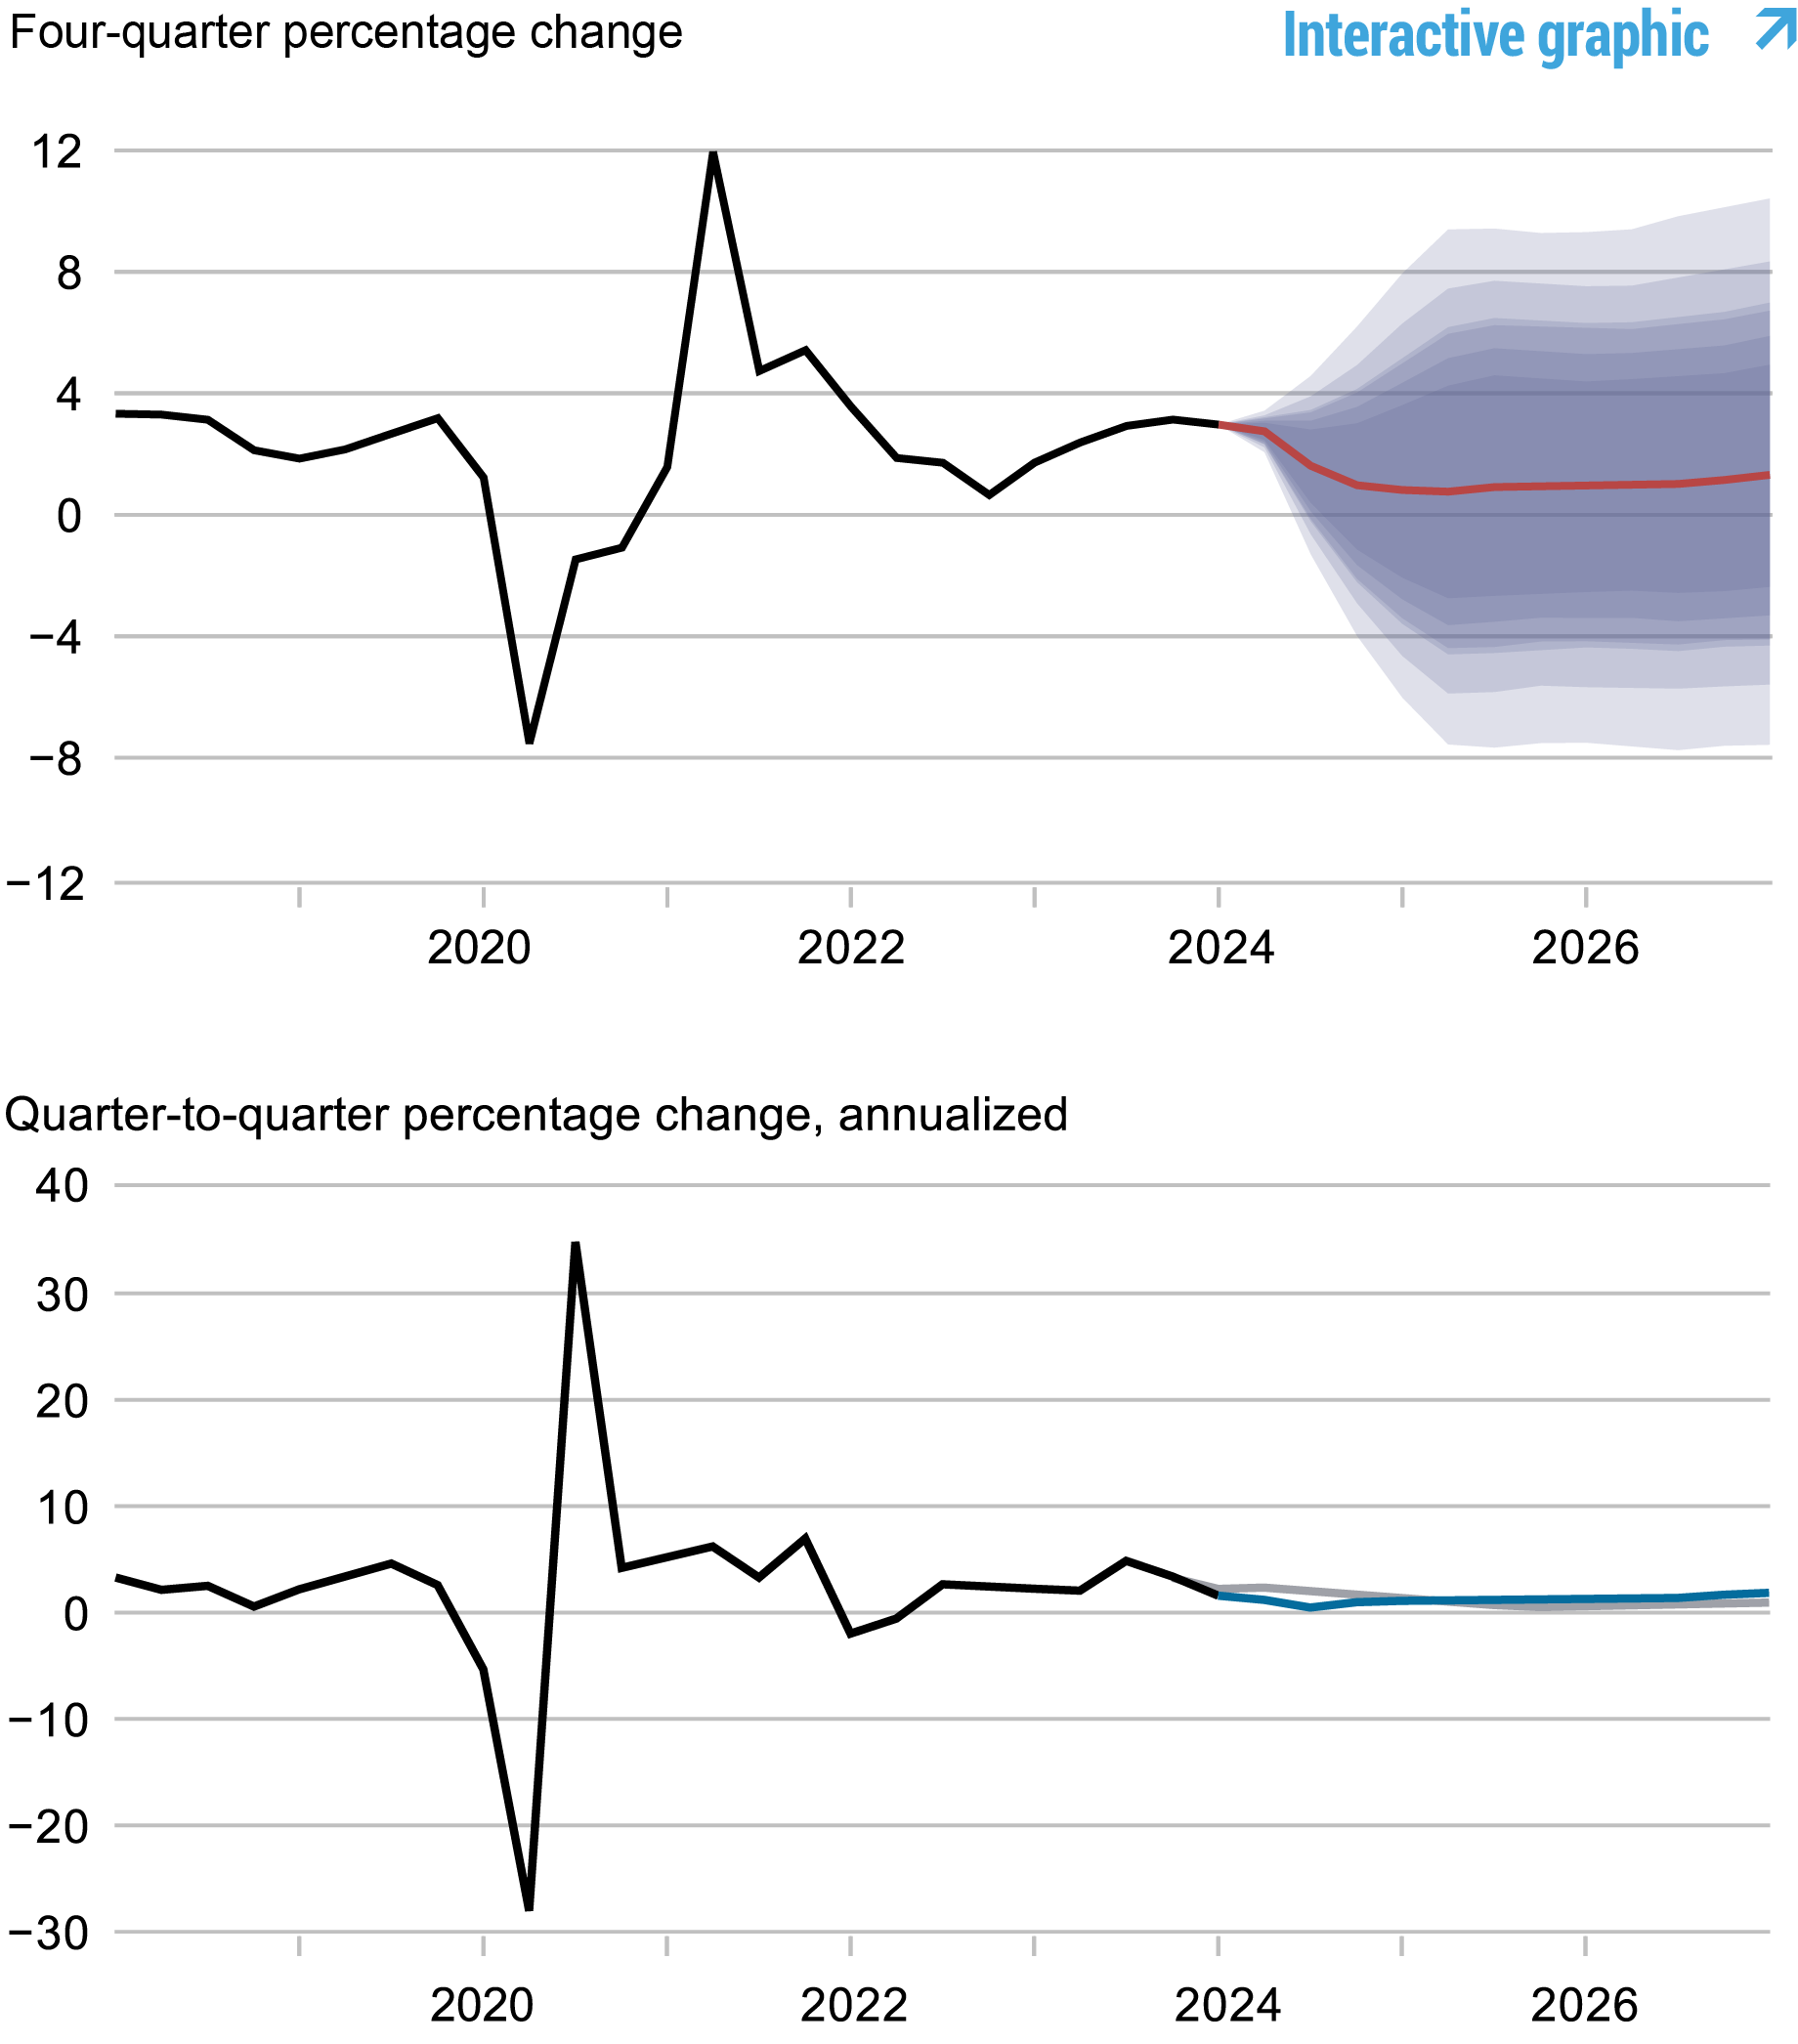
Source: Authors’ calculations
Notes: These two panels depict output growth. In the top panel, the black line indicates actual data and the red line shows the model forecasts. The shaded areas mark the uncertainty associated with our forecasts at 50, 60, 70, 80, and 90 percent probability intervals. In the bottom panel, the blue line shows the current forecast (quarter-to-quarter, annualized), and the gray line shows the March 2024 forecast.
Forecasts of Inflation
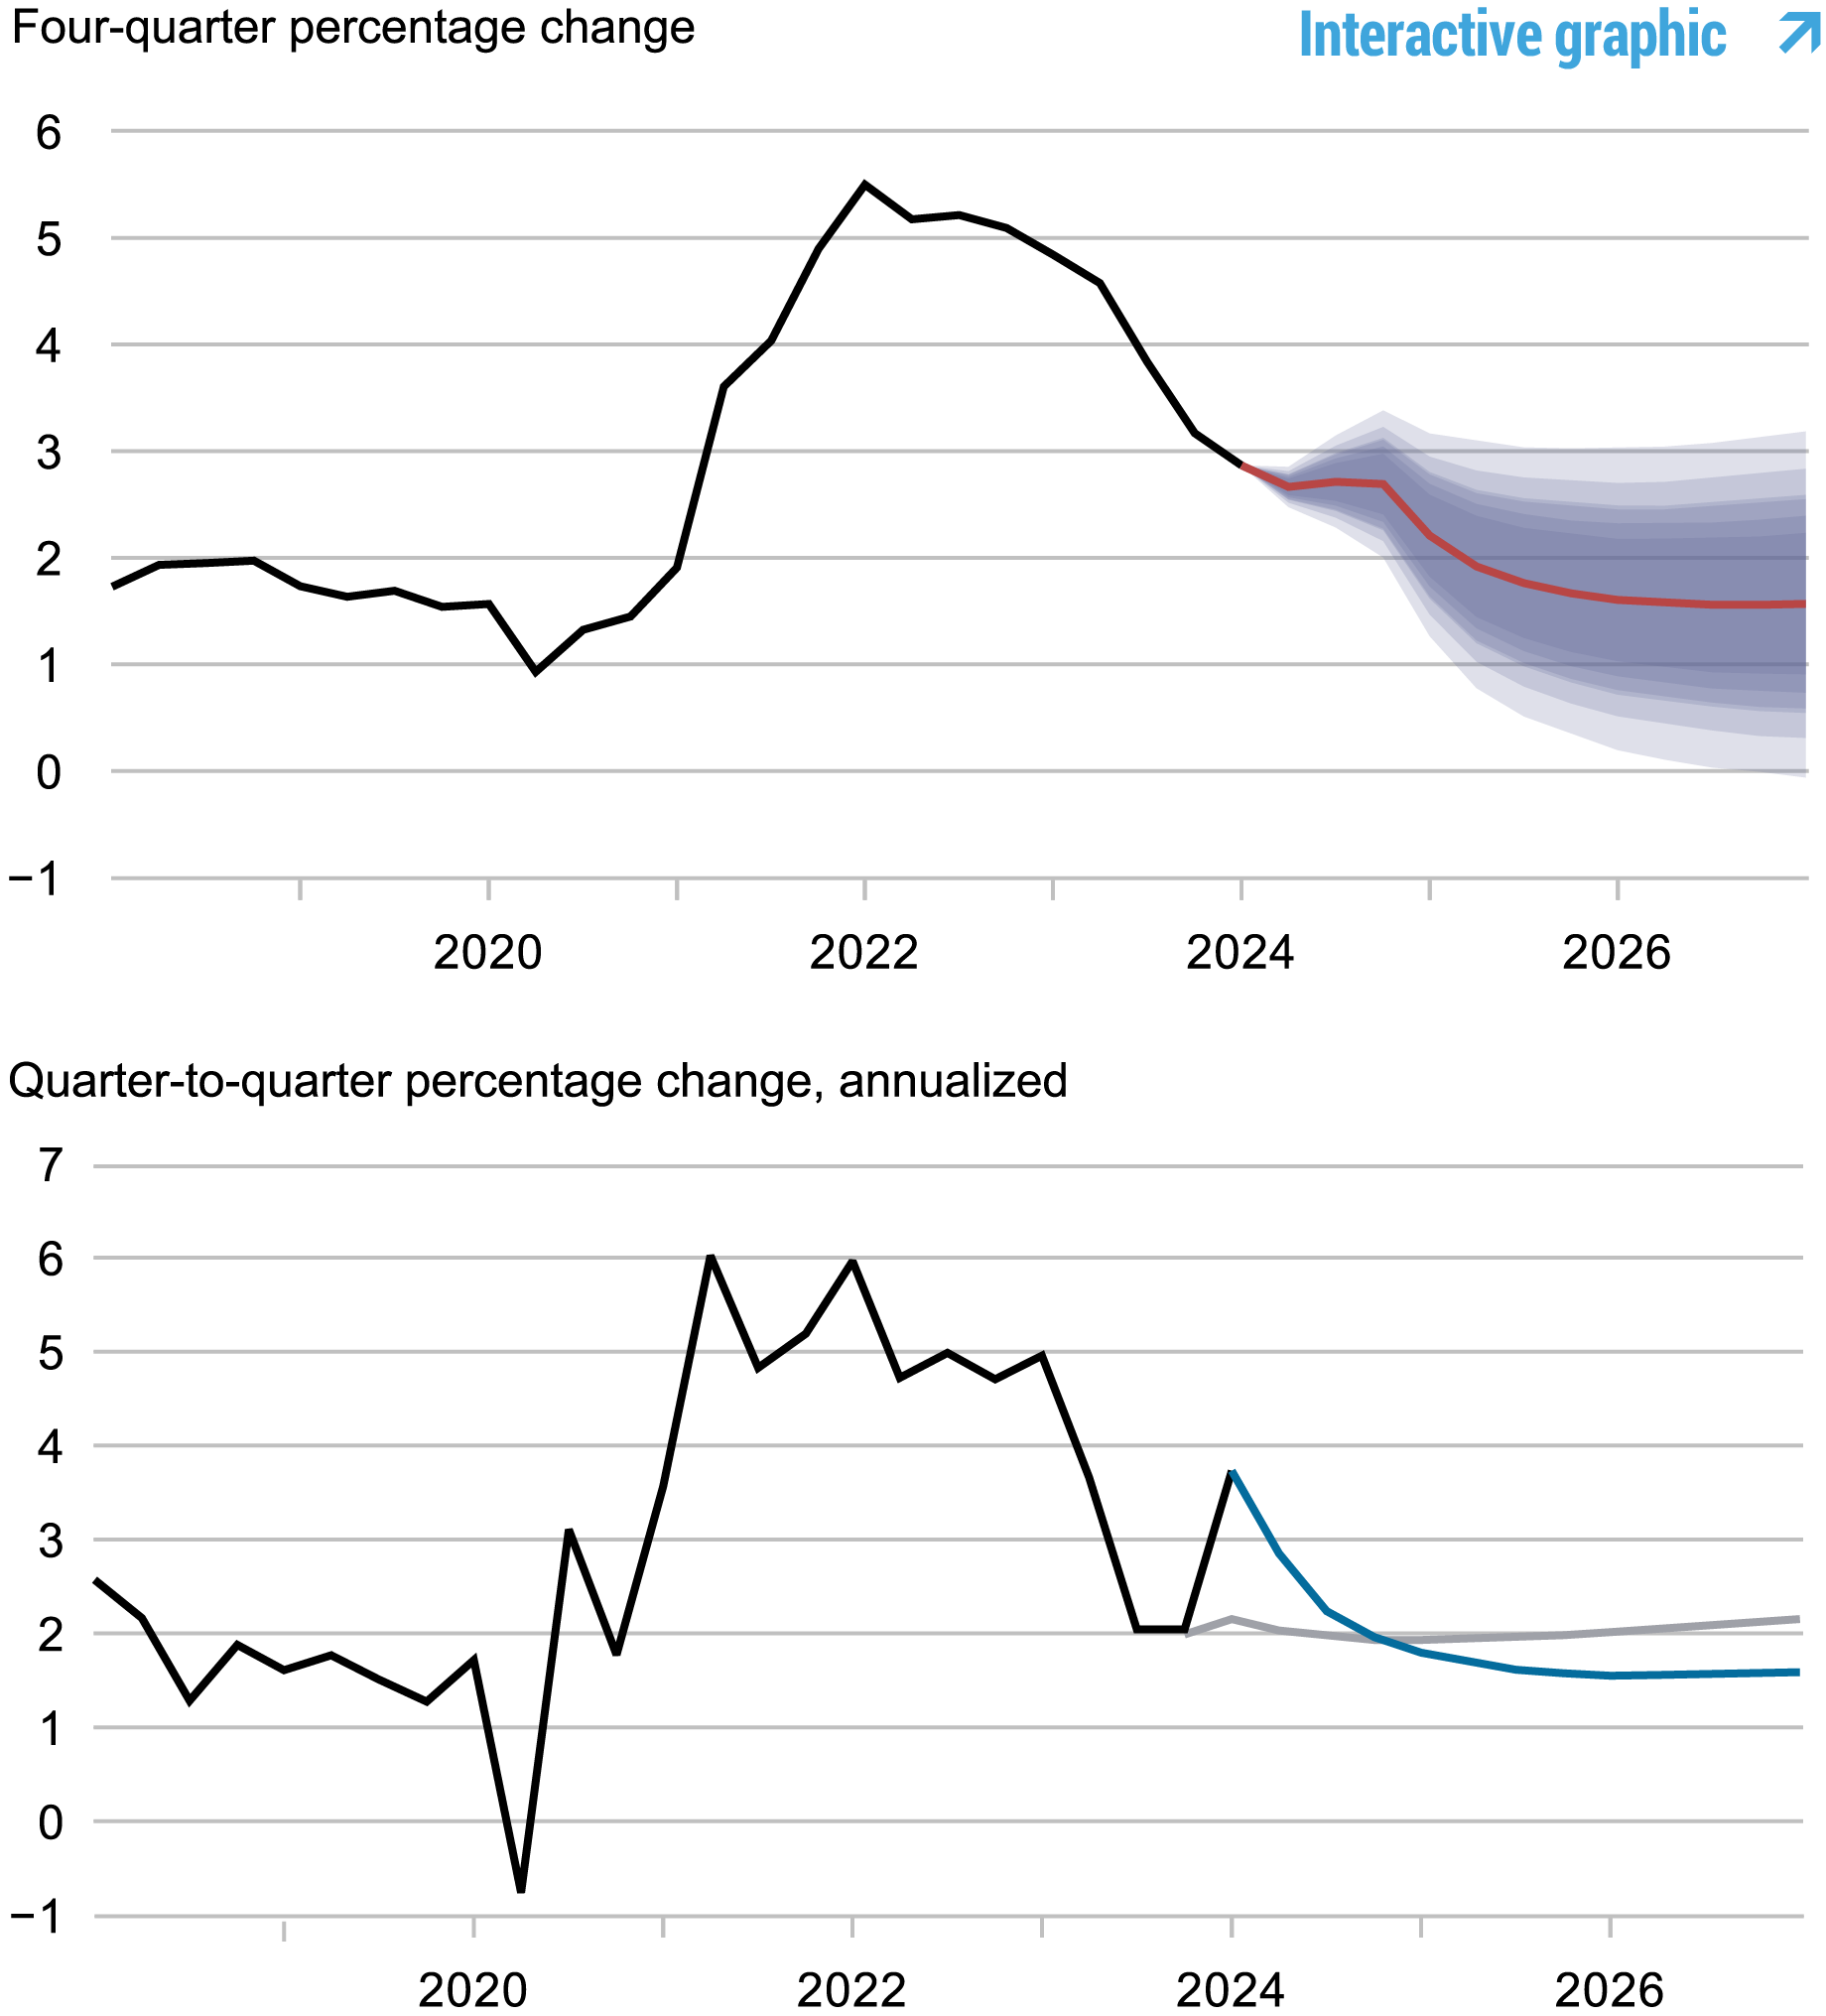
Source: Authors’ calculations.
Notes: These two panels depict core personal consumption expenditures (PCE) inflation. In the top panel, the black line indicates actual data and the red line shows the model forecasts. The shaded areas mark the uncertainty associated with our forecasts at 50, 60, 70, 80, and 90 percent probability intervals. In the bottom panel, the blue line shows the current forecast (quarter-to-quarter, annualized), and the gray line shows the March 2024 forecast.
Real Natural Rate of Interest
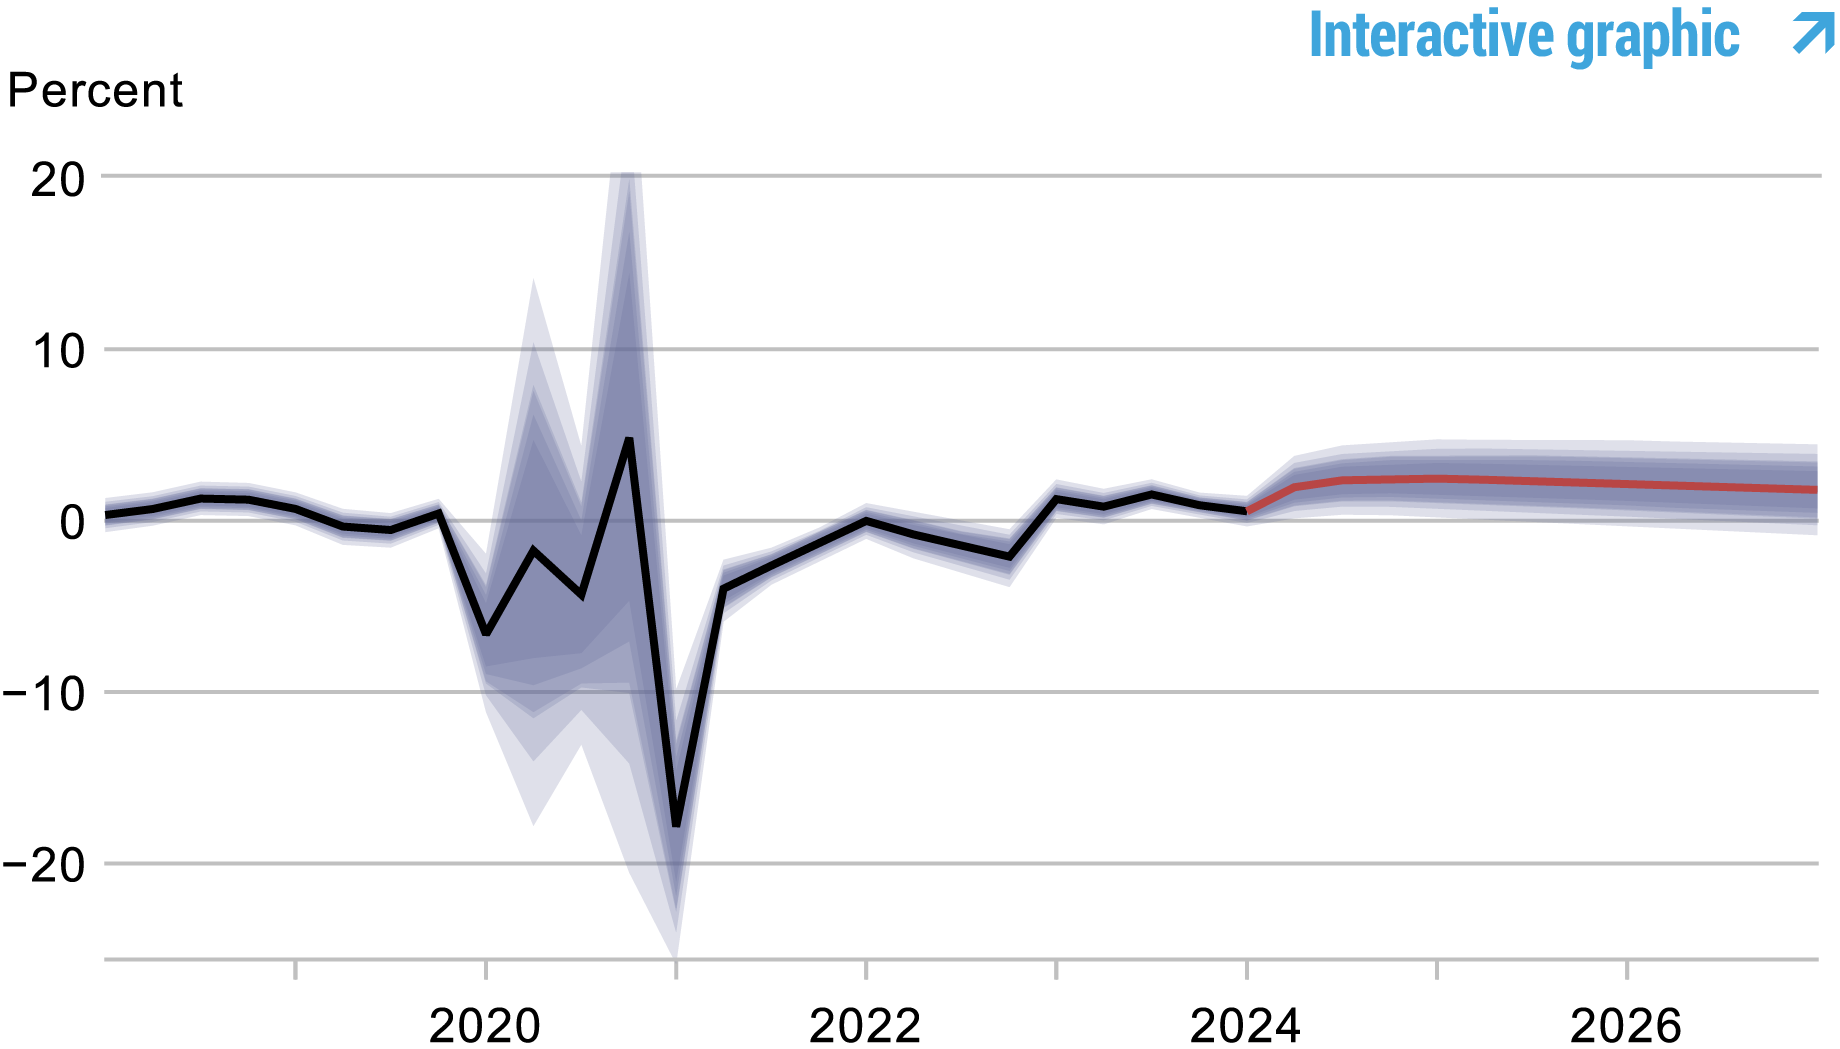
Source: Authors’ calculations.
Notes: The black line shows the model’s mean estimate of the real natural rate of interest; the red line shows the model forecast of the real natural rate. The shaded area marks the uncertainty associated with the forecasts at 50, 60, 70, 80, and 90 percent probability intervals.

Marco Del Negro is an economic research advisor in Macroeconomic and Monetary Studies in the Federal Reserve Bank of New York’s Research and Statistics Group.

Pranay Gundam is a research analyst in the Bank’s Research and Statistics Group.

Donggyu Lee is a research economist in Macroeconomic and Monetary Studies in the Federal Reserve Bank of New York’s Research and Statistics Group.

Ramya Nallamotu is a research analyst in the Bank’s Research and Statistics Group.

Brian Pacula is a research analyst in the Bank’s Research and Statistics Group.
How to cite this post:
Marco Del Negro, Pranay Gundam, Donggyu Lee, Ramya Nallamotu, and Brian Pacula, “The New York Fed DSGE Model Forecast—June 2024,” Federal Reserve Bank of New York Liberty Street Economics, June 14, 2024, https://libertystreeteconomics.newyorkfed.org/2024/06/the-new-york-fed-dsge-model-forecast-june-2024/
BibTeX: View |


Disclaimer
The views expressed in this post are those of the author(s) and do not necessarily reflect the position of the Federal Reserve Bank of New York or the Federal Reserve System. Any errors or omissions are the responsibility of the author(s).
 RSS Feed
 Follow Liberty Street Economics