


This post uses the New York Fed DSGE model to ask the question: What would have happened to interest rates, output, and inflation had the Federal Reserve been following an average inflation targeting (AIT)-type reaction function since 2021:Q2, when inflation began to rise—as opposed to keeping the federal funds rate at the zero lower bound (ZLB) until March 2022, and then raising it aggressively thereafter? We show that actual policy was more accommodative in 2021 than implied by the AIT reaction function and then more contractionary in 2022 and beyond. On net, the lagged effect of monetary policy on the level of GDP, when measured relative to the counterfactual, has been positive throughout the forecast horizon, due to the initial boost associated with keeping the fed funds rate near zero in 2021.
A Counterfactual: What If the Fed Had Stuck to the AIT Rule?
The AIT reaction function assumed throughout this exercise is in line with the 2020 monetary policy framework review. The parameters of the AIT rule—specifically its response to inflation and output “misses,” and its inertia (the coefficient on lagged interest rates)—were calibrated as of 2020:Q3 in order to match the expected duration of the zero lower bound (ZLB) given the economic conditions in the middle of the COVID pandemic (see here for more details).
Our purpose here is to use our DSGE model to simulate how the economy would have performed if the monetary policy rate had not deviated from the AIT reaction function starting in 2021:Q2. The exercise can be described as follows: What would have happened to the economy had the FOMC followed the reaction function that rationalized the September 2020 pledge to keep rates at the ZLB for an extended period given expectations at that time, and therefore deviated from the ZLB pledge—in accordance with the AIT rule—when inflation strayed away from this expected path starting in 2021:Q2? The results of this counterfactual experiment need to be taken with a grain of salt, of course, as they are only as good as the model that produces them.
The upper left panel in the chart below shows the actual path of the fed funds rate (FFR) and the current baseline forecast after 2023:Q2 (red) versus the counterfactual path had the FOMC followed the AIT rule starting in 2021:Q2 (blue). The counterfactual path for all the variables is constructed by subjecting the counterfactual economy to the same shocks that, according to the model, have hit the actual economy, with the only difference between the two economies being the monetary policy pursued by the FOMC. So, for instance, the cost-push shocks that are the main cause for the burst in inflation (bottom left panel) in 2021 in the model (see this post) also have an impact on inflation in the counterfactual economy. Similarly, under the baseline path, we see growth rebounding in the second half of 2022 and 2023—a rebound that was due to strong demand (see this post), in line with the BVAR analysis in our accompanying post. These very shocks affect the path in the counterfactual economy as well.
Counterfactual with AIT Reaction Function Starting in 2021:Q2
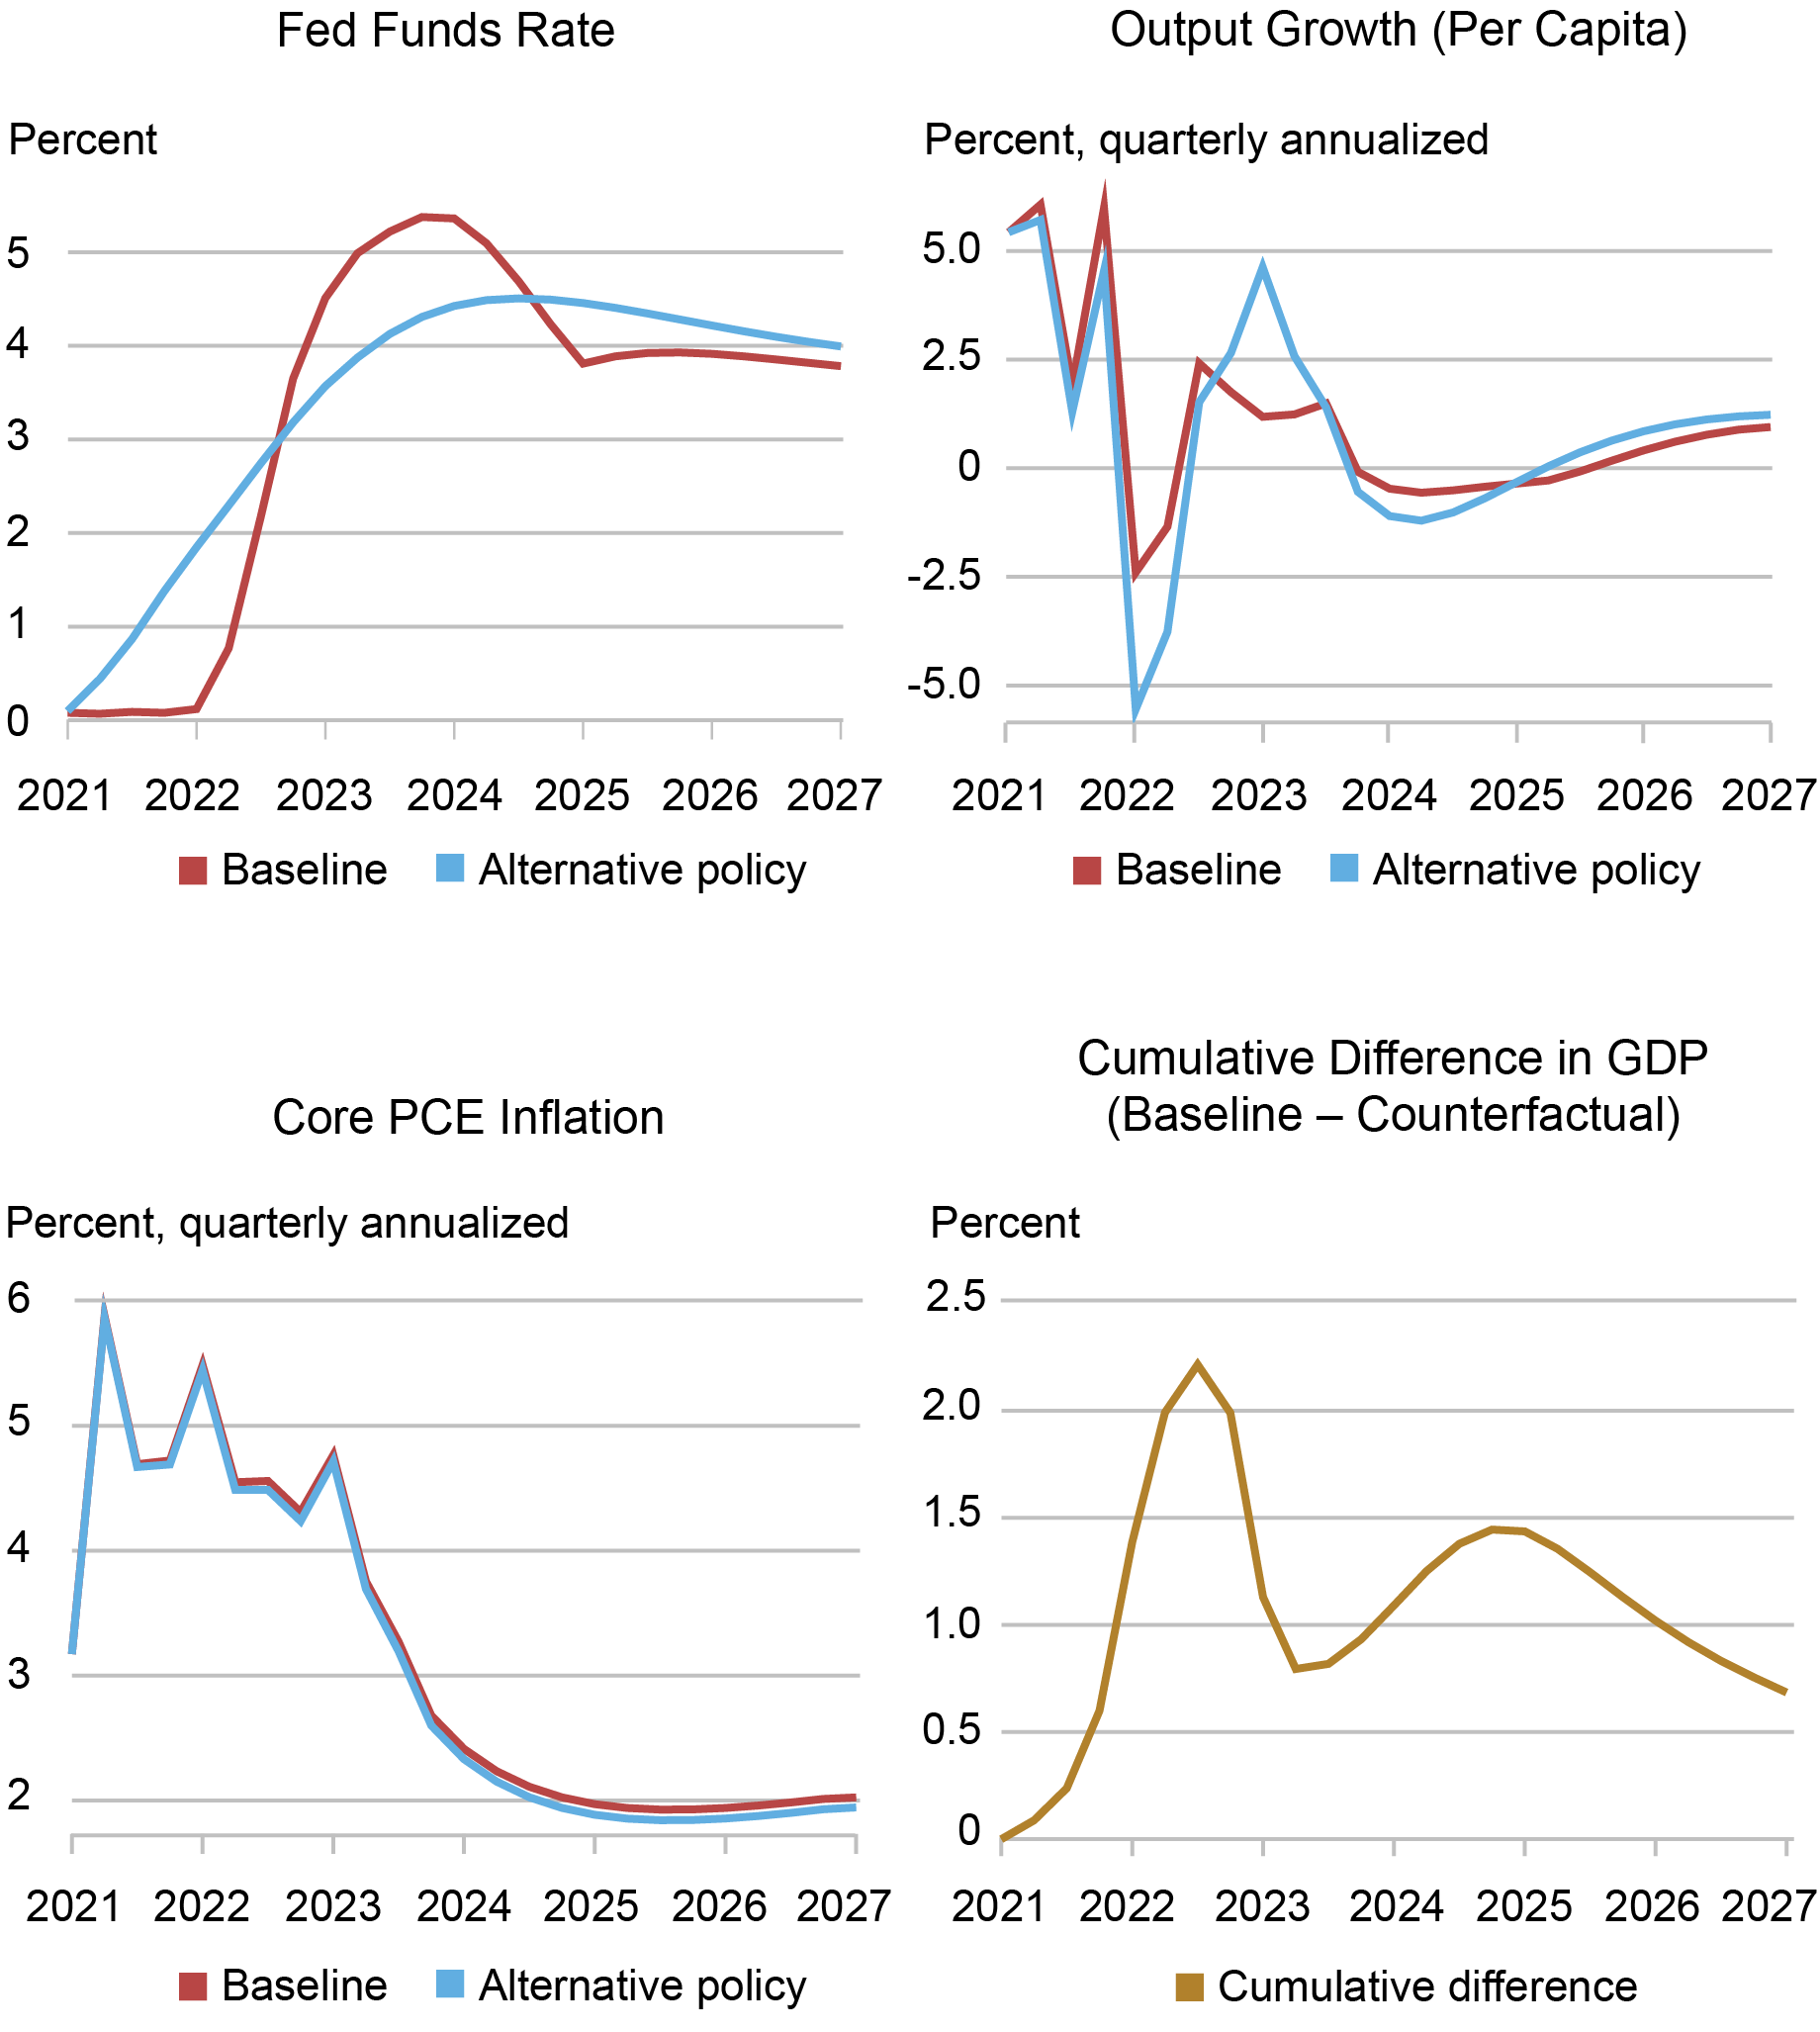
Source: Authors’ calculations.
Had the FOMC followed the AIT reaction function starting in 2021:Q2, rates would have risen immediately. The counterfactual FFR path then falls below the actual FFR path in the middle of last year, remains lower than the baseline path through mid-2024, and then eventually converges from above to the actual forecasted path for interest rates. Had the FOMC pursued this policy, per capita output growth (quarterly annualized, upper right panel) would have been lower in 2022 and higher in 2023. The lower output growth in 2022 is the result of tightening in 2021, while the stronger growth this year originates from the less aggressive pace of tightening in 2022 and 2023.
The bottom right panel shows that deviations from the AIT rule have been expansionary on net. The panel shows the gap in output levels that developed starting in 2021:Q2 between the baseline and the alternative path. The counterfactual level of output is below the actual level and the gap between the two rises to a peak of about 2 percent in mid-2022, followed by a narrowing in 2023 caused by the more aggressive pace of tightening under actual policy in that year. The gap then briefly widens again in 2024-25 as actual policy eases faster than the AIT rule. On net, the lagged effect of monetary policy on economic activity, when measured relative to a counterfactual where policy follows the AIT rule, has been positive throughout the forecast horizon, due to the initial boost associated with keeping the FFR at near zero in 2021.
The lower left panel shows that inflation rates do not differ significantly between the two policy rules. This is in part because the model has a weak connection between output and inflation because of its flat Phillips curve. In part this is because in the New York Fed DSGE forecasts we have been assuming that agents in the model have been only partially aware of the change in the policy framework from inflation targeting to AIT, with a weight that increases over time. In all alternative simulations so far, we have continued to maintain this assumption: when adopting an alternative policy, the central bank was not affecting the way “unaware” agents form expectations, implying that the weakening of the economy shown in the lower right panel is not internalized by firms when setting prices.
Focusing on the Hiking Period
The chart below abstracts from the 2021 ZLB policy and isolates the effect of the aggressive tightening in 2022 and 2023. That is, the DSGE model simulation now starts in 2022:Q2. The chart shows that the pace of tightening in 2022 and early 2023 was more aggressive than implied by the AIT reaction function, even considering the large positive average inflation miss accumulated in the previous quarters. The model allows for both contemporaneous as well as anticipated policy shocks. The former are deviations from the AIT reaction function that take place in the quarter in which they are announced. The latter are shocks to expected future rates–in other words, forward guidance shocks. In the estimation, these anticipated shocks are identified using FFR expectations obtained in each quarter from the most recent Survey of Primary Dealers. According to the model, there were two large contractionary shocks of about 100 basis points, both contemporaneous, in 2022:Q4 and 2023:Q1. Forward guidance shocks did not play a major role in the hiking period, except for a 50-basis point expansionary six-quarter-ahead anticipated shock in 2023:Q2, which explains why the baseline FFR path falls below the AIT-implied path after mid-2024. The fact that most deviations from the reaction function are due to contemporaneous shocks implies that the aggressive hiking cycle had not been anticipated by the public, possibly limiting its effects on the economy.
Counterfactual with AIT Reaction Function Starting in 2022:Q2
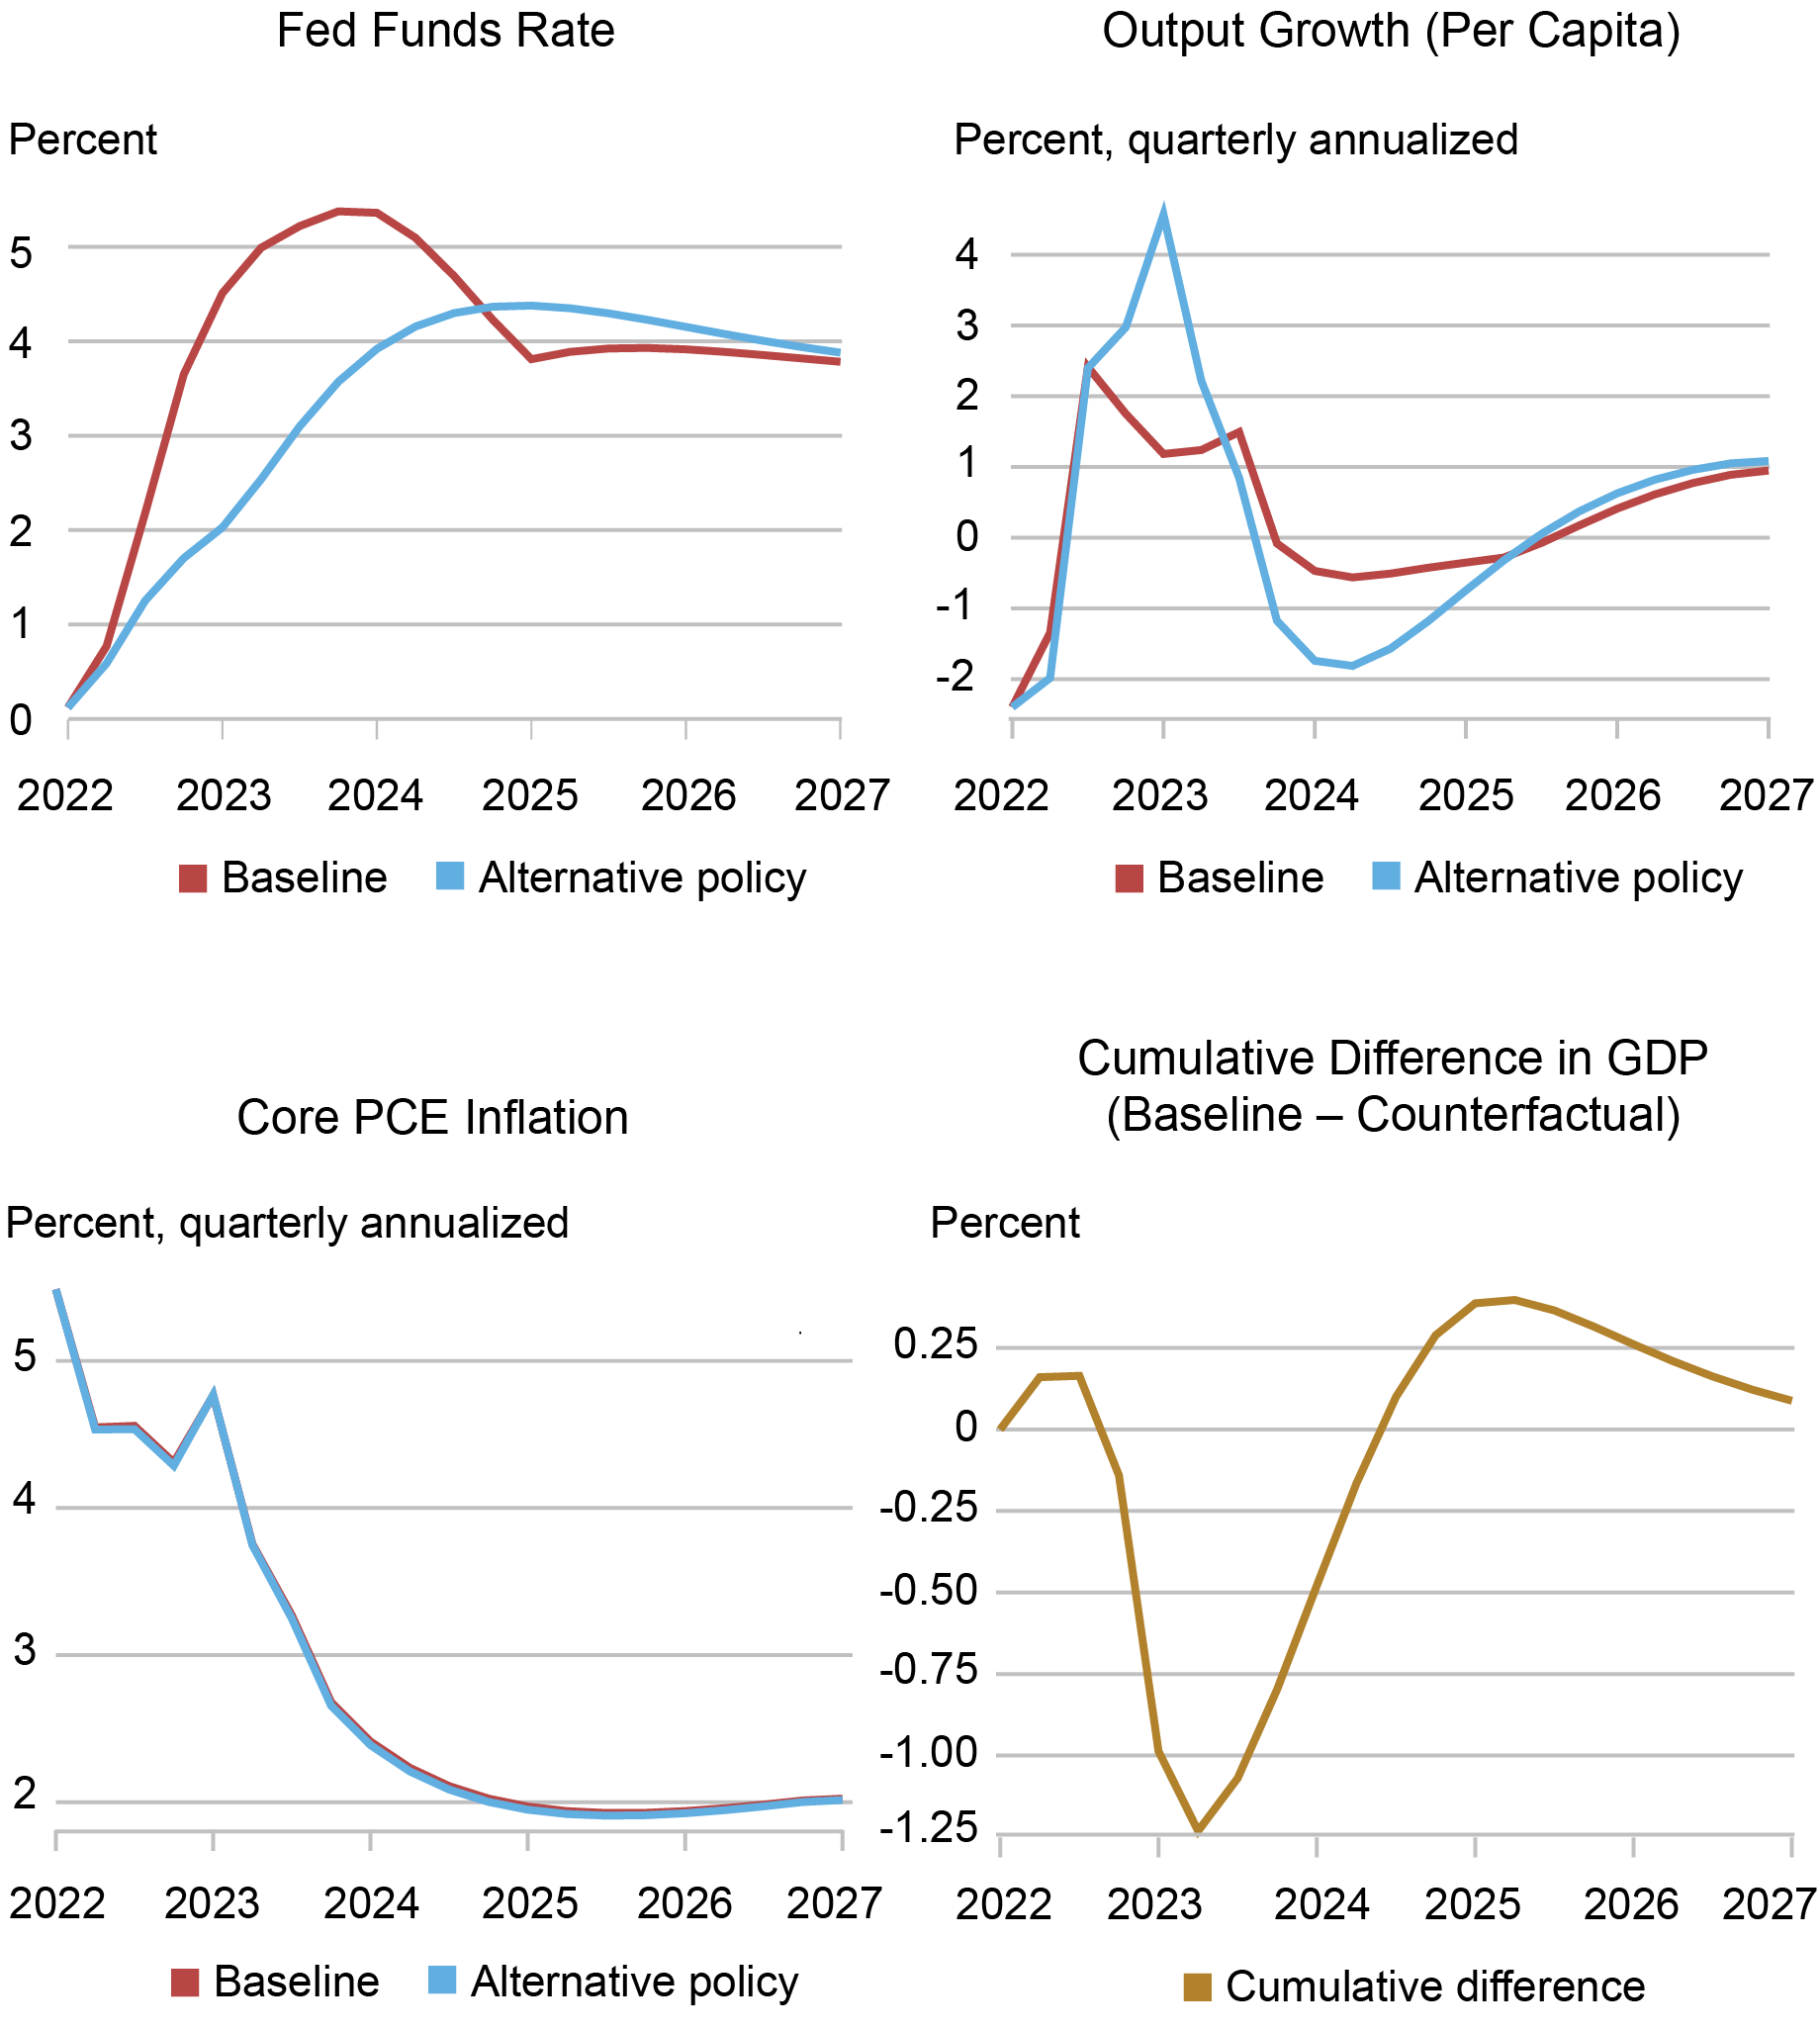
Source: Authors’ calculations.
The effect of these policy shocks on economic activity has been restrictive, with their cumulative effect peaking in mid-2023 with the actual level of output being about 1.25 percent below the AIT counterfactual. The gap then narrows sharply from late 2023 and through 2024 as the AIT policy pushes rates higher over this period while the expected baseline path has the policy rate falling. Note that the projected slowdown in growth in late 2023 and 2024 that takes place under the baseline projection is not due to the lagged effects of the rate hikes in 2022 and 2023. Without these rate hikes the slowdown would be even more pronounced, simply because their peak effect on the level of activity has already been reached and so their contribution to growth is actually positive, at least according to the model.
To conclude, in this post we asked what would have happened had the Fed followed an AIT reaction function starting in 2021:Q2. We show that relative to this counterfactual, actual policy was accommodative in 2021 and then contractionary in 2022 and thereafter, and that the combined effect on economic activity of these deviations from the AIT reaction function has been expansionary and remains so according to the model.

Richard K. Crump is a financial research advisor in Macrofinance Studies in the Federal Reserve Bank of New York’s Research and Statistics Group.

Marco Del Negro is an economic research advisor in Macroeconomic and Monetary Studies in the Federal Reserve Bank of New York’s Research and Statistics Group.

Keshav Dogra is a senior economist and economic research advisor in Macroeconomic and Monetary Studies in the Federal Reserve Bank of New York’s Research and Statistics Group.

Pranay Gundam is a research analyst in the Federal Reserve Bank of New York’s Research and Statistics Group.

Donggyu Lee is a research economist in Macroeconomic and Monetary Studies in the Federal Reserve Bank of New York’s Research and Statistics Group.

Ramya Nallamotu is a research analyst in the Federal Reserve Bank of New York’s Research and Statistics Group.

Brian Pacula is a research analyst in the Federal Reserve Bank of New York’s Research and Statistics Group.
How to cite this post:
Richard Crump, Marco Del Negro, Keshav Dogra, Pranay Gundam, Donggyu Lee, Ramya Nallamotu, and Brian Pacula, “The New York Fed DSGE Model Perspective on the Lagged Effect of Monetary Policy,” Federal Reserve Bank of New York Liberty Street Economics, November 21, 2023, https://libertystreeteconomics.newyorkfed.org/2023/11/the-new-york-fed-dsge-model-perspective-on-the-lagged-effect-of-monetary-policy/
BibTeX: View |


Disclaimer
The views expressed in this post are those of the author(s) and do not necessarily reflect the position of the Federal Reserve Bank of New York or the Federal Reserve System. Any errors or omissions are the responsibility of the author(s).
 RSS Feed
 Follow Liberty Street Economics