


Over the last few years, the U.S. economy has experienced unusually high inflation and an unprecedented pace of monetary policy tightening. While inflation has fallen recently, it remains above target, and the economy continues to expand at a robust pace. Does the resilience of the U.S. economy imply that monetary policy has been ineffectual? Or does it reflect that policy acts with “long and variable lags” and so we haven’t yet observed the full effect of the monetary tightening that has already taken place? Using a Bayesian vector autoregressive (BVAR) model, we show that economic activity has, indeed, been substantially stronger than would have been anticipated considering the rapid policy tightening. Still, the model expects a significant slowdown in 2024-25, even though short-term interest rates are forecasted to fall.
High Inflation and High Growth?
To study the behavior of the U.S. economy over the last few years, we use a large BVAR model that features thirty-five macroeconomic and financial time series, five lags of past data, and is estimated over the sample ranging from the second quarter of 1973 through the end of 2019. For further details see this paper. To answer our question of interest we will rely on so-called “conditional forecasts.” In loose terms, a conditional forecast is the best guess of a future value of a variable when one has knowledge about the future value or values of some other set of variables.
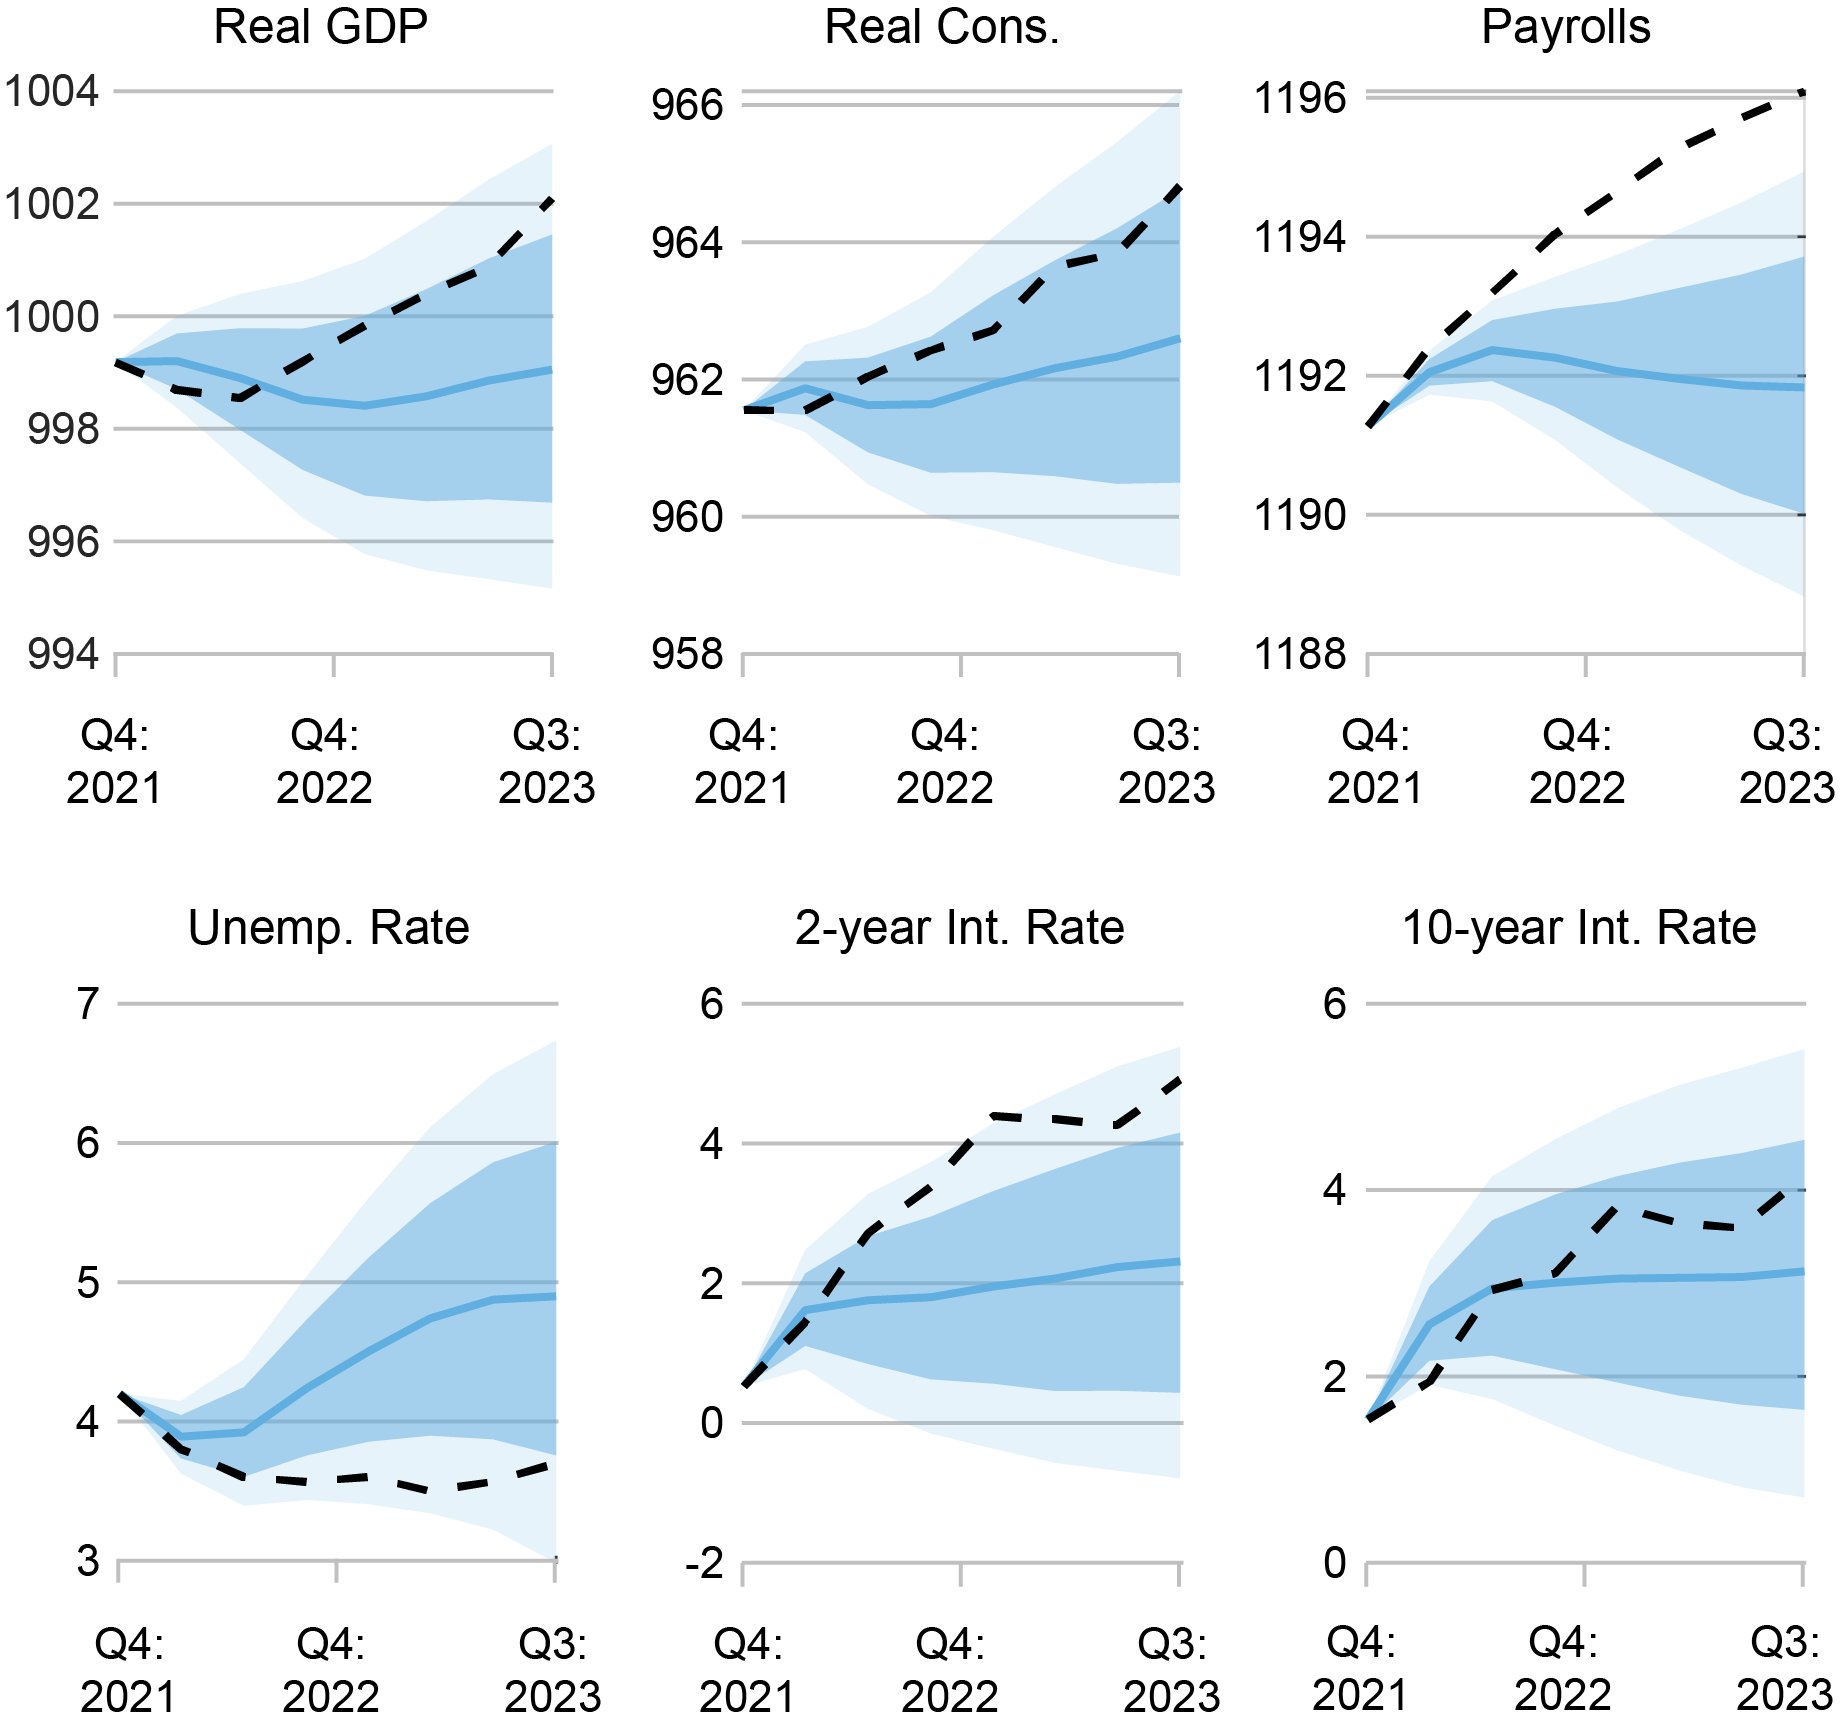
In our first exercise, we feed the model all the historical information available up to the fourth quarter of 2021 and the path of price inflation in 2022 and the first three quarters of 2023. We are asking the model: if you only knew the path of inflation since 2021, what would you predict for other economic and financial series such as real GDP growth, the unemployment rate, or interest rates over these seven quarters? The chart below shows the conditional forecast (blue line) and shaded regions denoting the associated pointwise posterior coverage intervals (dark shading 68 percent and light shading 90 percent). The dashed lines represent the path of the realized data.
2021:Q4 Forecasts Conditional on the Path of Inflation
Sources: Bureau of Economic Analysis; Bureau of Labor Statistics; Board of Governors of the Federal Reserve System; authors’ calculations.
Notes: The chart shows the conditional forecast (blue line) and shaded regions denoting the associated pointwise posterior coverage intervals (dark shading 68 percent and light shading 90 percent). Dashed lines represent the path of the realized data. The top row reports results for the logarithm of real gross domestic product (Real GDP), real personal consumption expenditures (Real Cons.), and nonfarm payrolls (Payrolls). The bottom row reports results for the civilian unemployment rate (Unemp. Rate), the two-year nominal interest rate (2-Year Int. Rate), and the ten-year nominal interest rate (10-Year Int. Rate).
The chart indicates that the model would have anticipated a modest increase in short-term interest rates and a recession, with the level of real GDP falling and the unemployment rate rising to about 5 percent. Intuitively, this reflects the fact that the unusually high inflation observed since 2021 would typically trigger tighter monetary policy, which would in turn lead to a recession. However, the rise in the two-year yield predicted by the model is substantially lower than the realized path: the rise in interest rates that did occur was over and above what would have been foreseen just based on the path of inflation.
High Inflation and Interest Rates and High Growth?
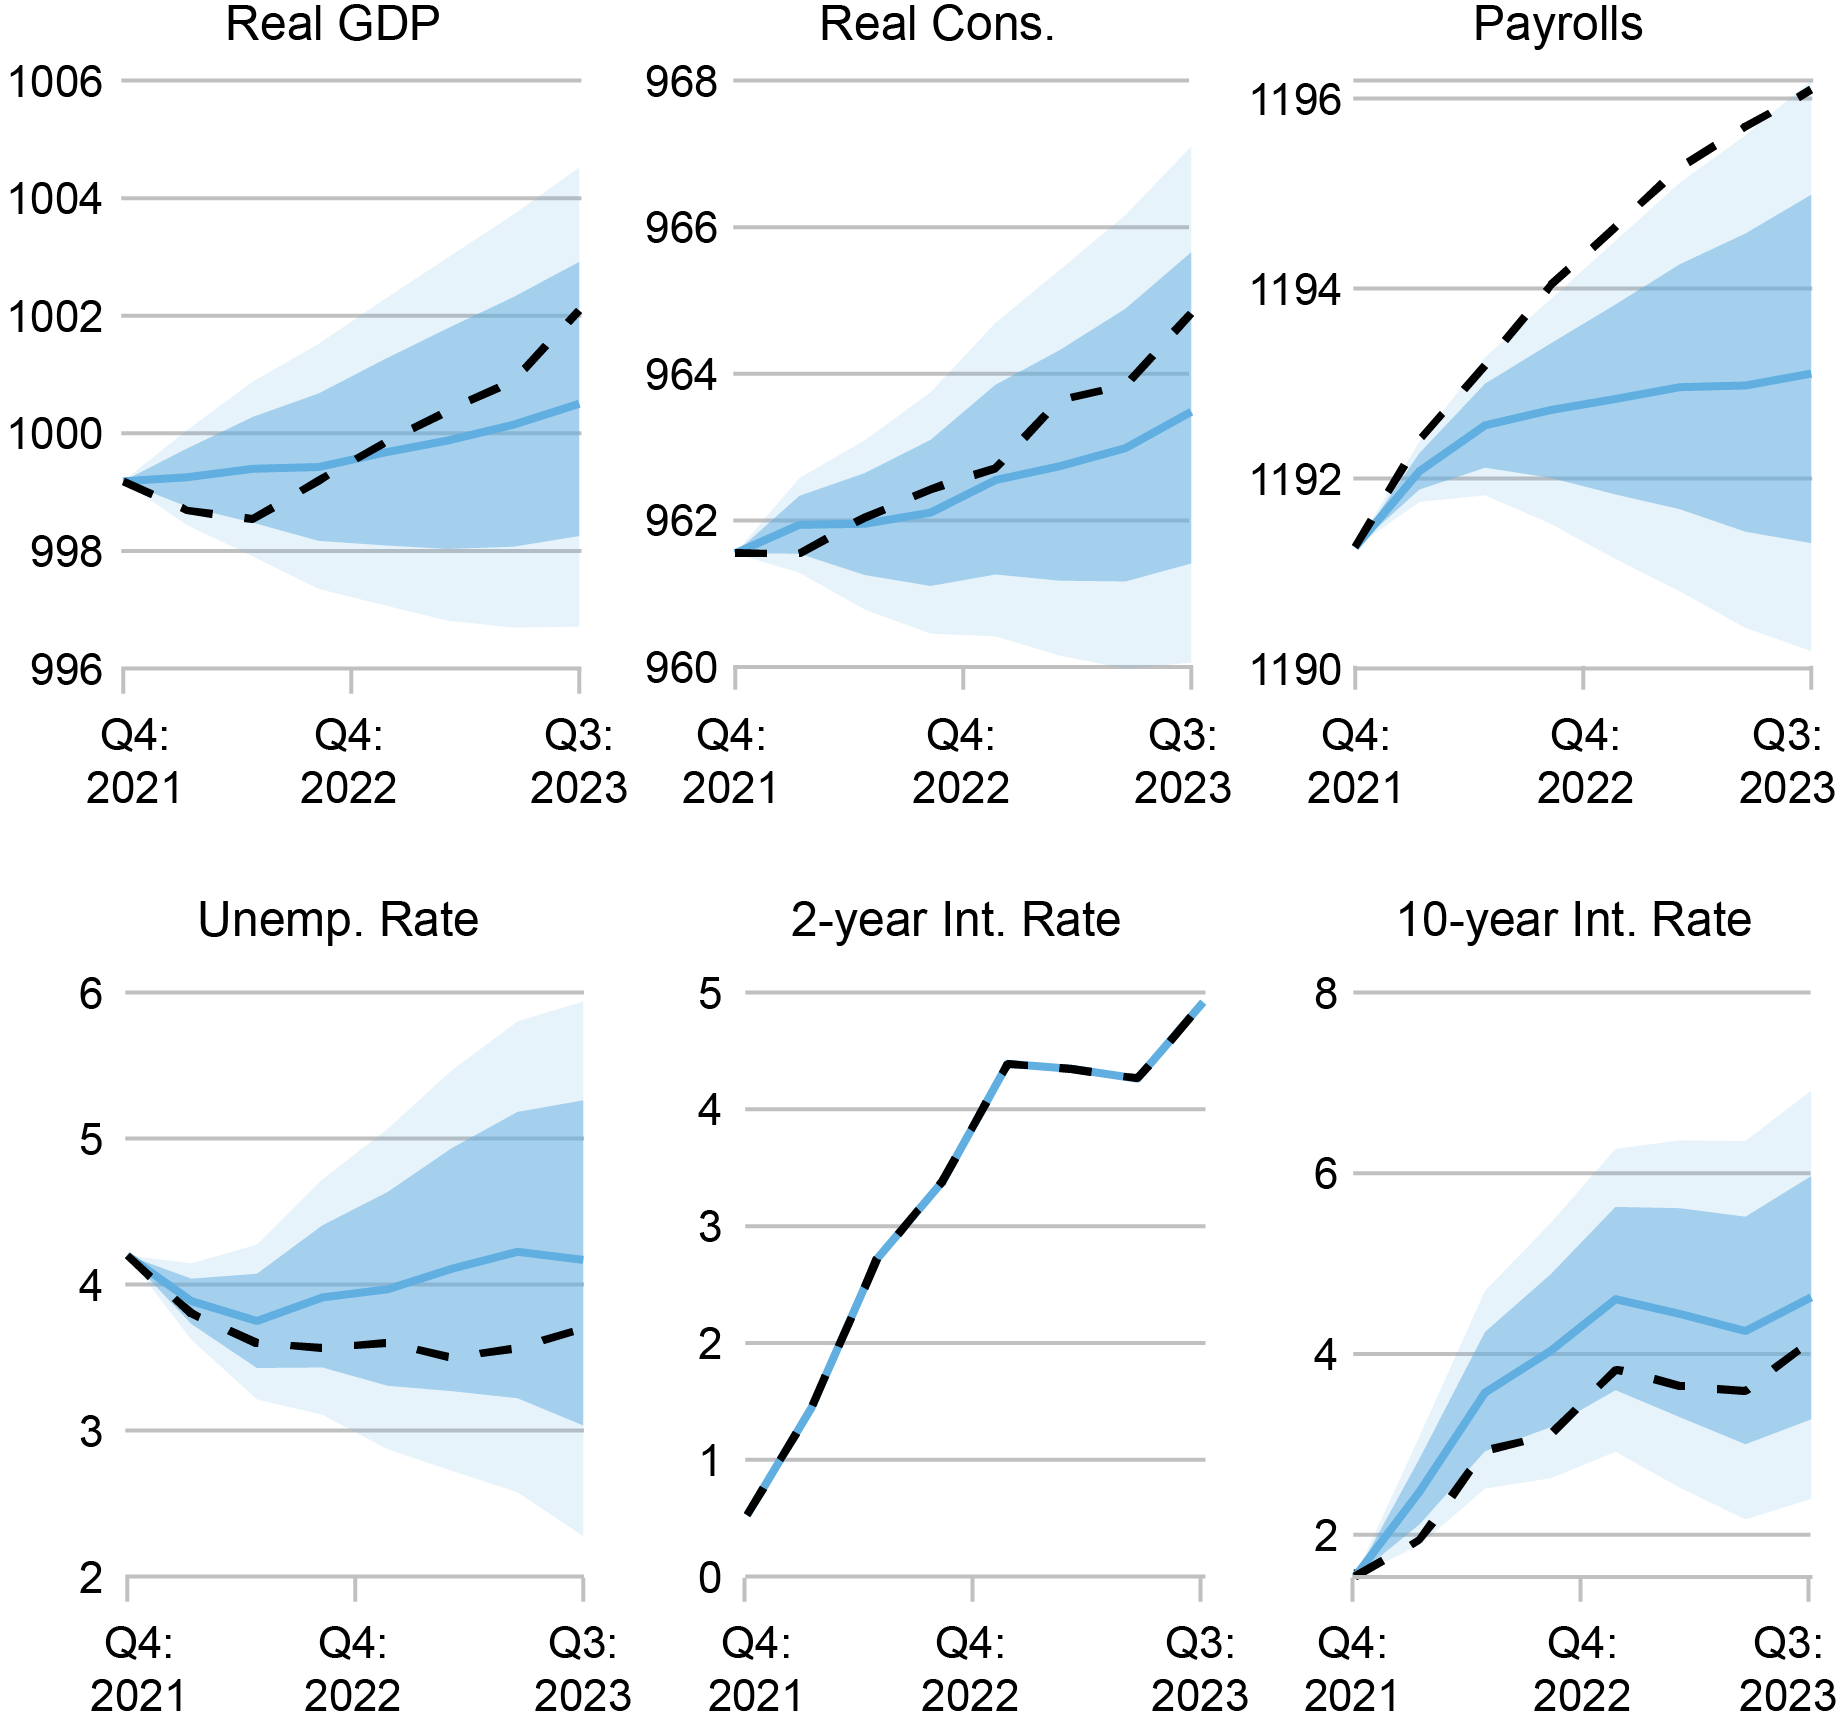
As we saw in the previous chart, short-term interest rates rose to much higher levels than the model would have anticipated based solely on the path of inflation since 2021. As a second exercise, we ask the model what the conditional forecast would be if, in addition to inflation since 2021, we also feed the model the future path of two-year nominal interest rates. This informs the model on the rapid rise in short-term interest rates since late 2021. The chart below presents the results from this exercise. Since we use the future path of the two-year interest rate in forming the forecast, the dashed and solid lines are the same.
2021:Q4 Forecasts Conditional on the Path of Inflation and Two-Year Yields
Sources: Bureau of Economic Analysis; Bureau of Labor Statistics; Board of Governors of the Federal Reserve System; authors’ calculations.
Notes: The chart shows the conditional forecast (blue line) and shaded regions denoting the associated pointwise posterior coverage intervals (dark shading 68 percent and light shading 90 percent). The dashed lines represent the path of the realized data. The top row reports results for the logarithm of real gross domestic product (Real GDP), real personal consumption expenditures (Real Cons.), and nonfarm payrolls (Payrolls). The bottom row reports results for the civilian unemployment rate (Unemp. Rate), the 2-year nominal interest rate (2-Year Int. Rate), and the 10-year nominal interest rate (10-Year Int. Rate).
In contrast to the previous exercise, when conditioning on the higher path of interest rates as well as inflation, the model forecasts only anemic growth but not an outright decline in activity. One interpretation is that the higher path of interest rates—relative to the forecasted path, conditioning on inflation—reflects, in part, a systematic monetary policy response to higher economic activity. Nonetheless, the model is still surprised on the upside by the realized activity data. As shown in the chart, consumption and labor market activity are meaningfully stronger than would be expected. In the center panel in the top row, we observe that realized real consumption has skirted the 68 percent coverage interval, whereas in the bottom left and top right panels the unemployment rate has done the same and payrolls have comfortably exceeded the intervals.
These results indicate that, conditional on the steep increase in short rates and elevated inflation over the past two years, we would have expected to see persistently slower real activity by now, even considering the lags with which monetary policy has acted in the past. This is consistent with the notion that the economy experienced positive demand shocks over this period, which offset the usual effect of tighter policy.
Current Forecast
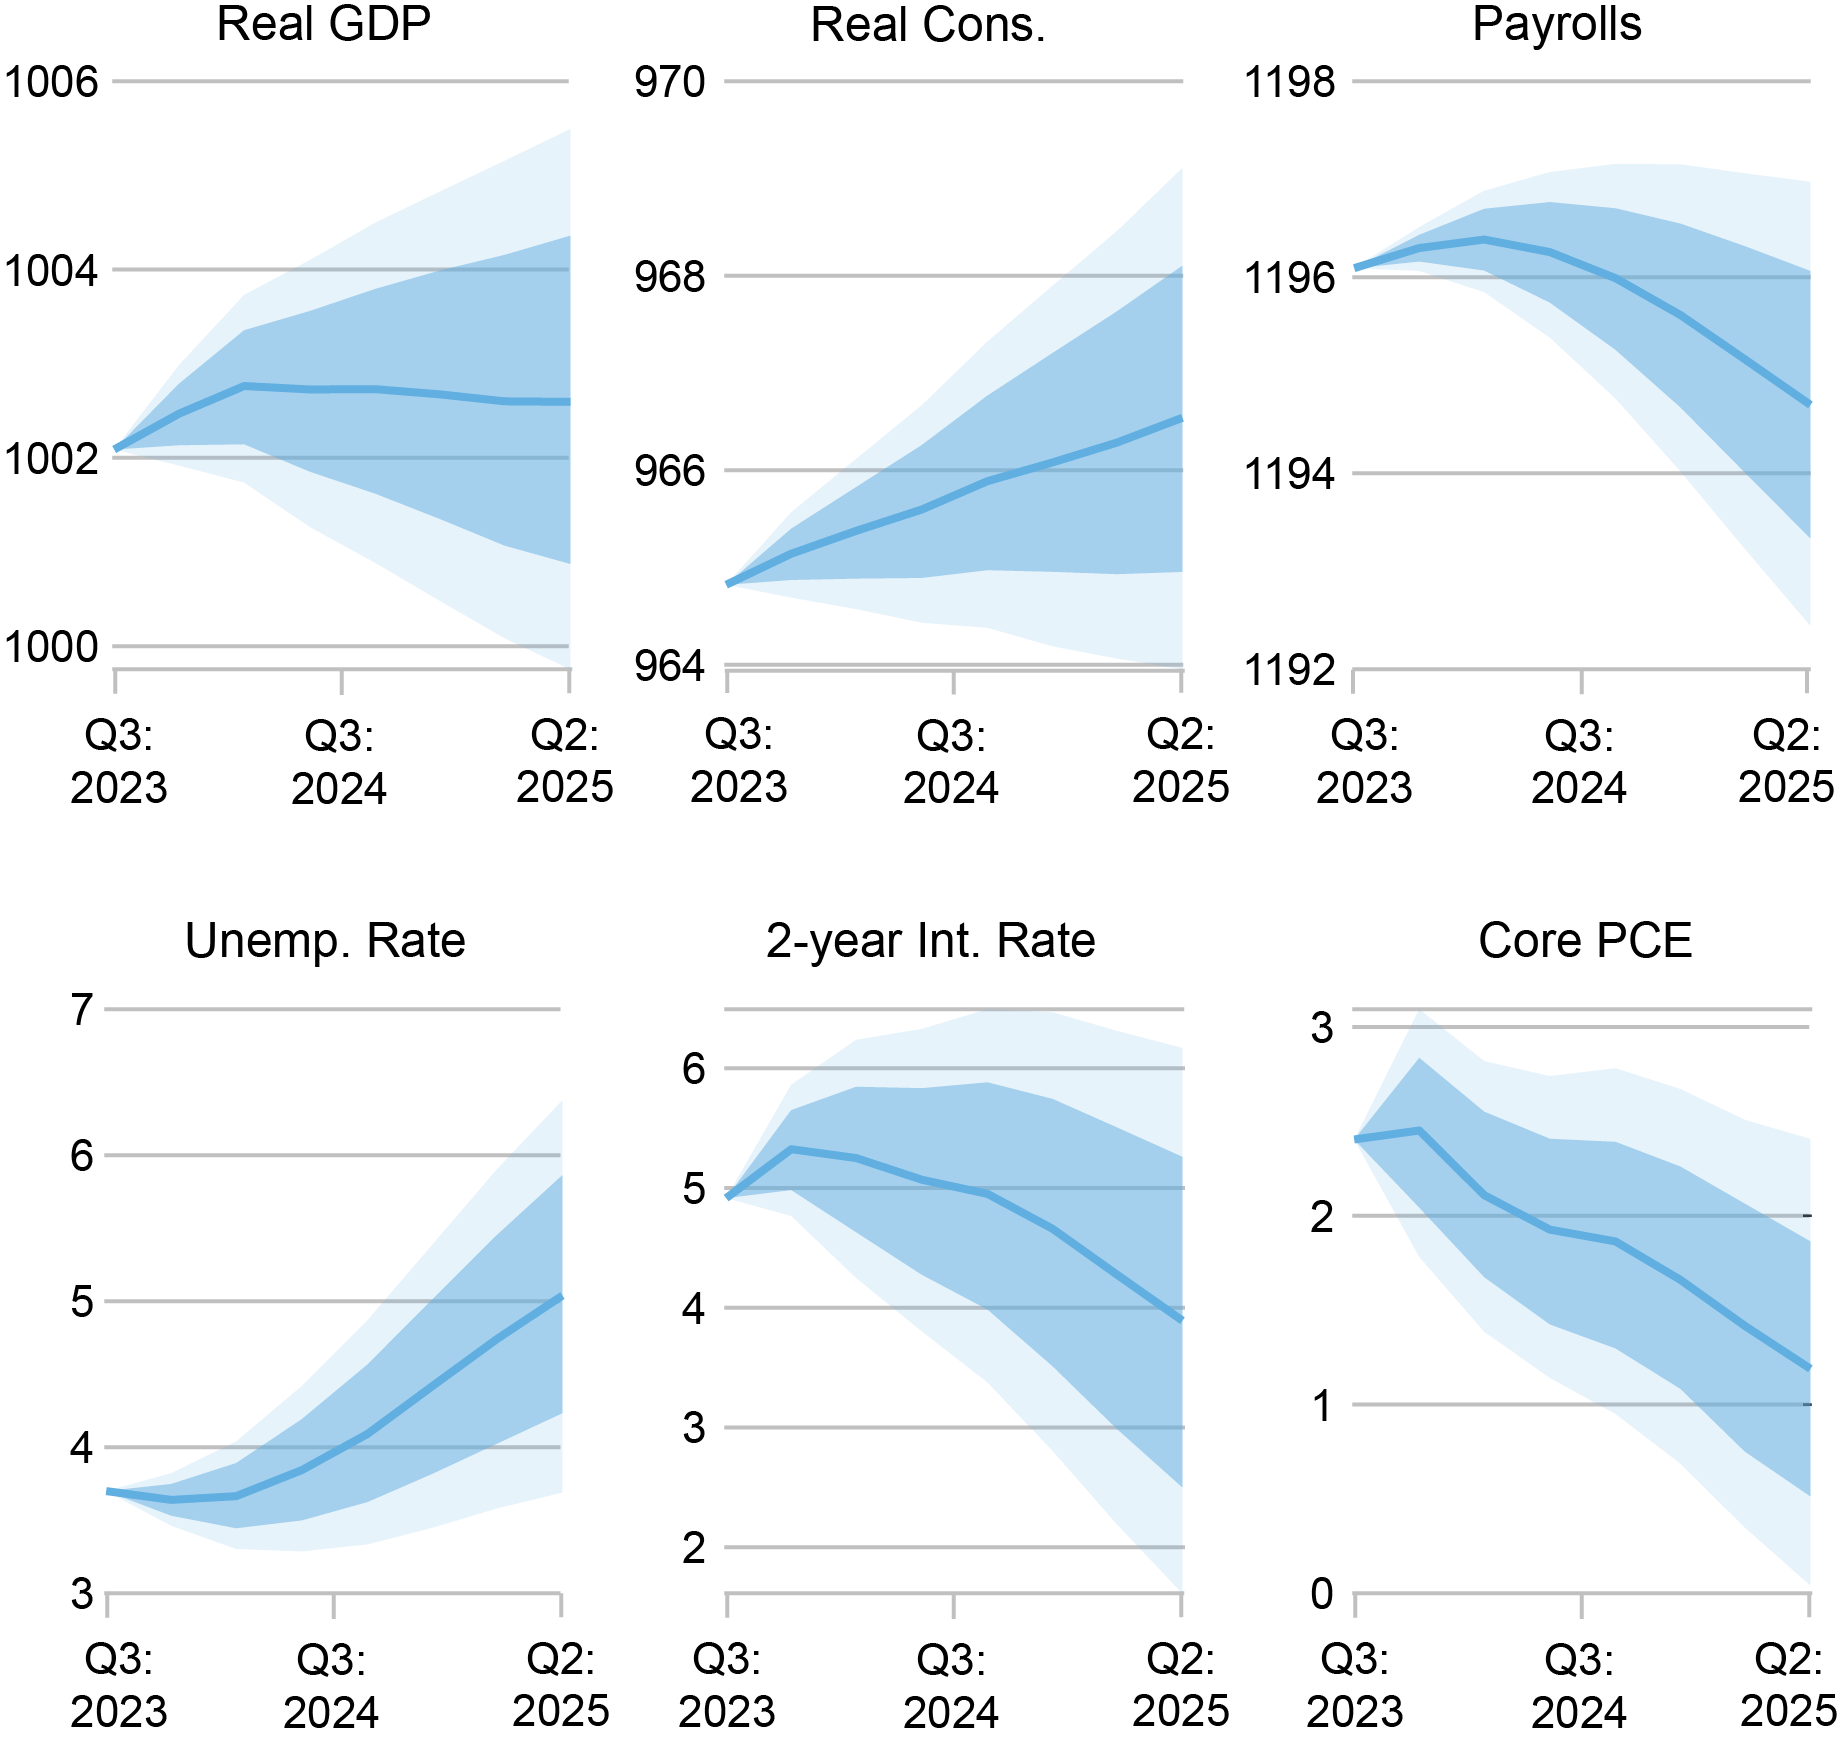
Do these results imply that without a significant further tightening of policy, we would expect activity and inflation to remain elevated? In the chart below, we report the current forecast based on the data available up to the third quarter of 2023. The forecast features a decline of more than 100 basis points in the two-year interest rate over the next two years. Nonetheless, the forecast features a slowdown in activity and inflation consistent with behavior observed in past slowdowns and NBER-defined U.S. recessions. Specifically, we observe a persistent decline in the level of real GDP (top left panel) starting in early 2024 in conjunction with a rising unemployment rate and a fall in payroll employment (bottom left and top right panels). Looking at the underlying detail (not shown in the chart), the decline in economic activity is led by real investment. Finally, in the chart below we also show the forecasted path for core PCE inflation (bottom right panel). Concomitant with the projected slowdown in real activity, the forecasted path of inflation continues its pre-existing decline and, in fact, falls below the target rate of 2 percent in 2024 and 2025.
Current BVAR Forecast
Sources: Bureau of Economic Analysis; Bureau of Labor Statistics; Board of Governors of the Federal Reserve System; authors’ calculations.
Notes: The chart shows the forecast (blue line) and shaded regions denoting the associated pointwise posterior coverage intervals (dark shading 68 percent and light shading 90 percent). The top row reports results for the logarithm of real gross domestic product (Real GDP), real personal consumption expenditures (Real Cons.), and nonfarm payrolls (Payrolls). The bottom row reports results for the civilian unemployment rate (Unemp. Rate), the 2-year nominal interest rate (2-Year Int. Rate), and core PCE inflation (Core PCE).
Conclusion
Taken together, the results from the three forecasting exercises suggest that economic activity in 2022-23 was stronger than expected conditional on the path of interest rates and inflation. But this does not imply that more tightening is required to slow real activity and reduce inflation. While the lagged effects of monetary tightening were counteracted by positive demand shocks in 2023-24, the model still expects a slowdown in 2024-25.
One limitation of our analysis is that the BVAR is a reduced-form model, which means that we cannot conduct a true counterfactual analysis. Said differently, we can’t answer questions such as: what would have happened if monetary policy—and only monetary policy—had been different since 2021? In our accompanying post, we will take an alternative approach that enables us to investigate these types of questions further.

Richard K. Crump is a financial research advisor in Macrofinance Studies in the Federal Reserve Bank of New York’s Research and Statistics Group.

Marco Del Negro is an economic research advisor in Macroeconomic and Monetary Studies in the Federal Reserve Bank of New York’s Research and Statistics Group.

Keshav Dogra is a senior economist and economic research advisor in Macroeconomic and Monetary Studies in the Federal Reserve Bank of New York’s Research and Statistics Group.

Pranay Gundam is a research analyst in the Federal Reserve Bank of New York’s Research and Statistics Group.

Donggyu Lee is a research economist in Macroeconomic and Monetary Studies in the Federal Reserve Bank of New York’s Research and Statistics Group.

Ramya Nallamotu is a research analyst in the Federal Reserve Bank of New York’s Research and Statistics Group.

Brian Pacula is a research analyst in the Federal Reserve Bank of New York’s Research and Statistics Group.
How to cite this post:
Richard Crump, Marco Del Negro, Keshav Dogra, Pranay Gundam, Donggyu Lee, Ramya Nallamotu, and Brian Pacula, “A Bayesian VAR Model Perspective on the Lagged Effect of Monetary Policy,” Federal Reserve Bank of New York Liberty Street Economics, November 21, 2023, https://libertystreeteconomics.newyorkfed.org/2023/11/a-bayesian-var-model-perspective-on-the-lagged-effect-of-monetary-policy/
BibTeX: View |

Disclaimer
The views expressed in this post are those of the author(s) and do not necessarily reflect the position of the Federal Reserve Bank of New York or the Federal Reserve System. Any errors or omissions are the responsibility of the author(s).
 RSS Feed
 Follow Liberty Street Economics
You attribute the better-than-expected growth outcome to positive demand shocks. This seems plausible, given that the overall fiscal deficit increased substantially from 2022 to 2023. However, another explanation could be that the effectiveness of monetary policy is even more delayed than in the past: A key element in this respect could be the increased prevalence of long-term (30-year) fixed-rate mortgages, which are more common now than, for example, in the 2000s, and largely at favourable low interest rates.