


Financial and technological innovation and changes in the macroeconomic environment have led to the growth of nonbank financial institutions (NBFIs), and to the possible displacement of banks in the provision of traditional financial intermediation services (deposit taking, loan making, and facilitation of payments). In this post, we look at the joint evolution of banks—referred to as depository institutions from here on—and nonbanks inside the organizational structure of bank holding companies (BHCs). Using a unique database of the organizational structure of all BHCs ever in existence since the 1970s, we document the evolution of NBFI activities within BHCs. Our evidence suggests that there exist important conglomeration synergies to having both banks and NBFIs under the same organizational umbrella.
The Evolution of Banks and Nonbanks: Alternative Views
The traditional view of financial intermediation is that banks and nonbanks evolve independently. Banks are fundamentally depository institution that make loans and facilitate payments, and their evolution remains anchored on these “core” activities. NBFIs, on the other hand, are seen as a heterogenous bunch—insurers, specialty lenders, investment funds, et cetera, with each segment operating under distinct business models, governing structures, and even regulations. One commonality of NBFIs, however, is that they can substitute for banks as financial intermediaries.
An alternative view is that banks evolve and adapt their business model to the prevalent mode of financial intermediation. Under this view, the evolution of banks and nonbanks is highly intertwined. For example, financial innovation and regulatory changes in the 1990s enhanced asset securitization, shifting the prevalent mode of financial intermediation from a bank-centric model of taking deposits and issuing loans (and holding them to maturity) to a new model where loans were packaged into securities and sold to investors. With this shift, several nonbank activities involving the provision of specialized services in support of the securitization process (such as specialty lending, making markets, managing assets, and insurance) grew in importance. Rather than remaining passive observers of these trends, banks adapted their business models and increasingly incorporated these new activities under their organizational umbrellas to take advantage of synergistic benefits. This alternative view implies that banks and NBFI activities may be complementary to one another and not substitutes.
In this post, we provide ample support for that alternative view. Our unique database of the organizational structure of all BHCs allows us to track each subsidiary in the banking industry over the last fifty years, map the subsidiary to its direct parent and to its ultimate parent, and track the activity that the subsidiary is engaged in. Using this data, we describe the joint evolution of banks and nonbanks over the past thirty years.
The Co-Evolution of Banks and Nonbanks
BHCs have historically had a substantial nonbank footprint. In the chart below, we decompose the activities of BHCs’ subsidiaries. For each quarter from 1990 to 2022, we select the top 200 BHCs by assets (collectively holding approximately 90 percent of industry assets), excluding Goldman Sachs, Morgan Stanley, and other BHCs that only entered the industry later in the sample period. We find that BHCs have thousands of subsidiaries, the vast majority of which are nonbanks. Over the years, BHCs have added entities such as nonbank lenders, broker-dealers, asset management institutions (funds), and insurers, among others. As of 2022:Q4, only about 8 percent of BHC subsidiaries were classified as commercial banks (depository institutions).
Composition of BHC Subsidiaries by Activity
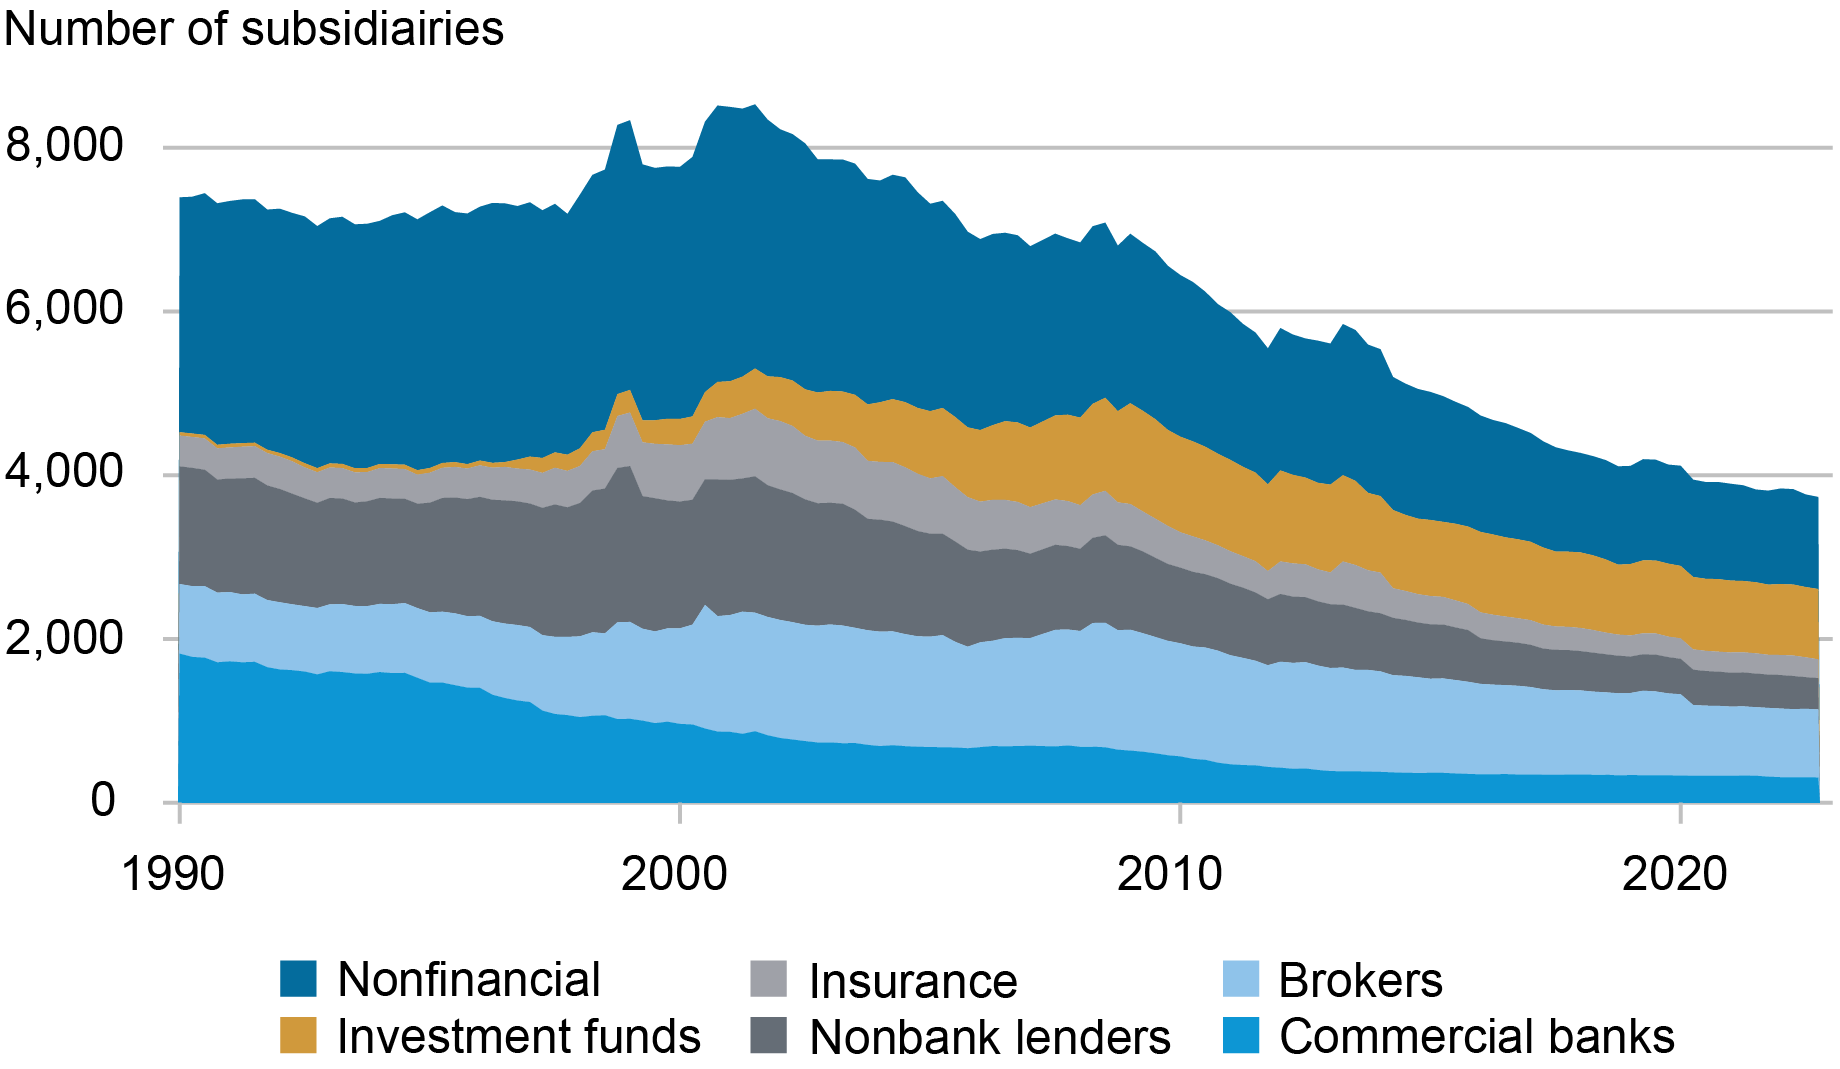
Sources: FR Y-10; authors’ calculations.
Note: We exclude the following BHCs: Goldman Sachs, Morgan Stanley, American Express, CIT Group, Ally Financial, Discover, M&T Bank, MetLife.
A view of nonbank activities centered on subsidiary counts may be misleading because those entities could just be empty shells created for legal reasons, or they could be incidental to the business, like the nonfinancial subsidiaries we observe in the chart above, but not necessarily reflecting activities the BHCs engage in. Instead, we find that nonbank subsidiaries are meaningful contributors to the business model of BHCs, as measured by the composition of their assets and income. In the chart below, we decompose the assets of the top 200 BHCs by subsidiary type: bank or nonbank. To do so, we take advantage of a lesser utilized reporting form, the FR Y-9LP, which captures the unconsolidated balance sheet of BHCs’ parent companies (or intermediate holding companies). As the chart shows, NBFIs account for a steadily increasing share of total BHC assets—about 15 percent, or more than $2.9 trillion, as of 2022:Q4.
Composition of BHC Assets
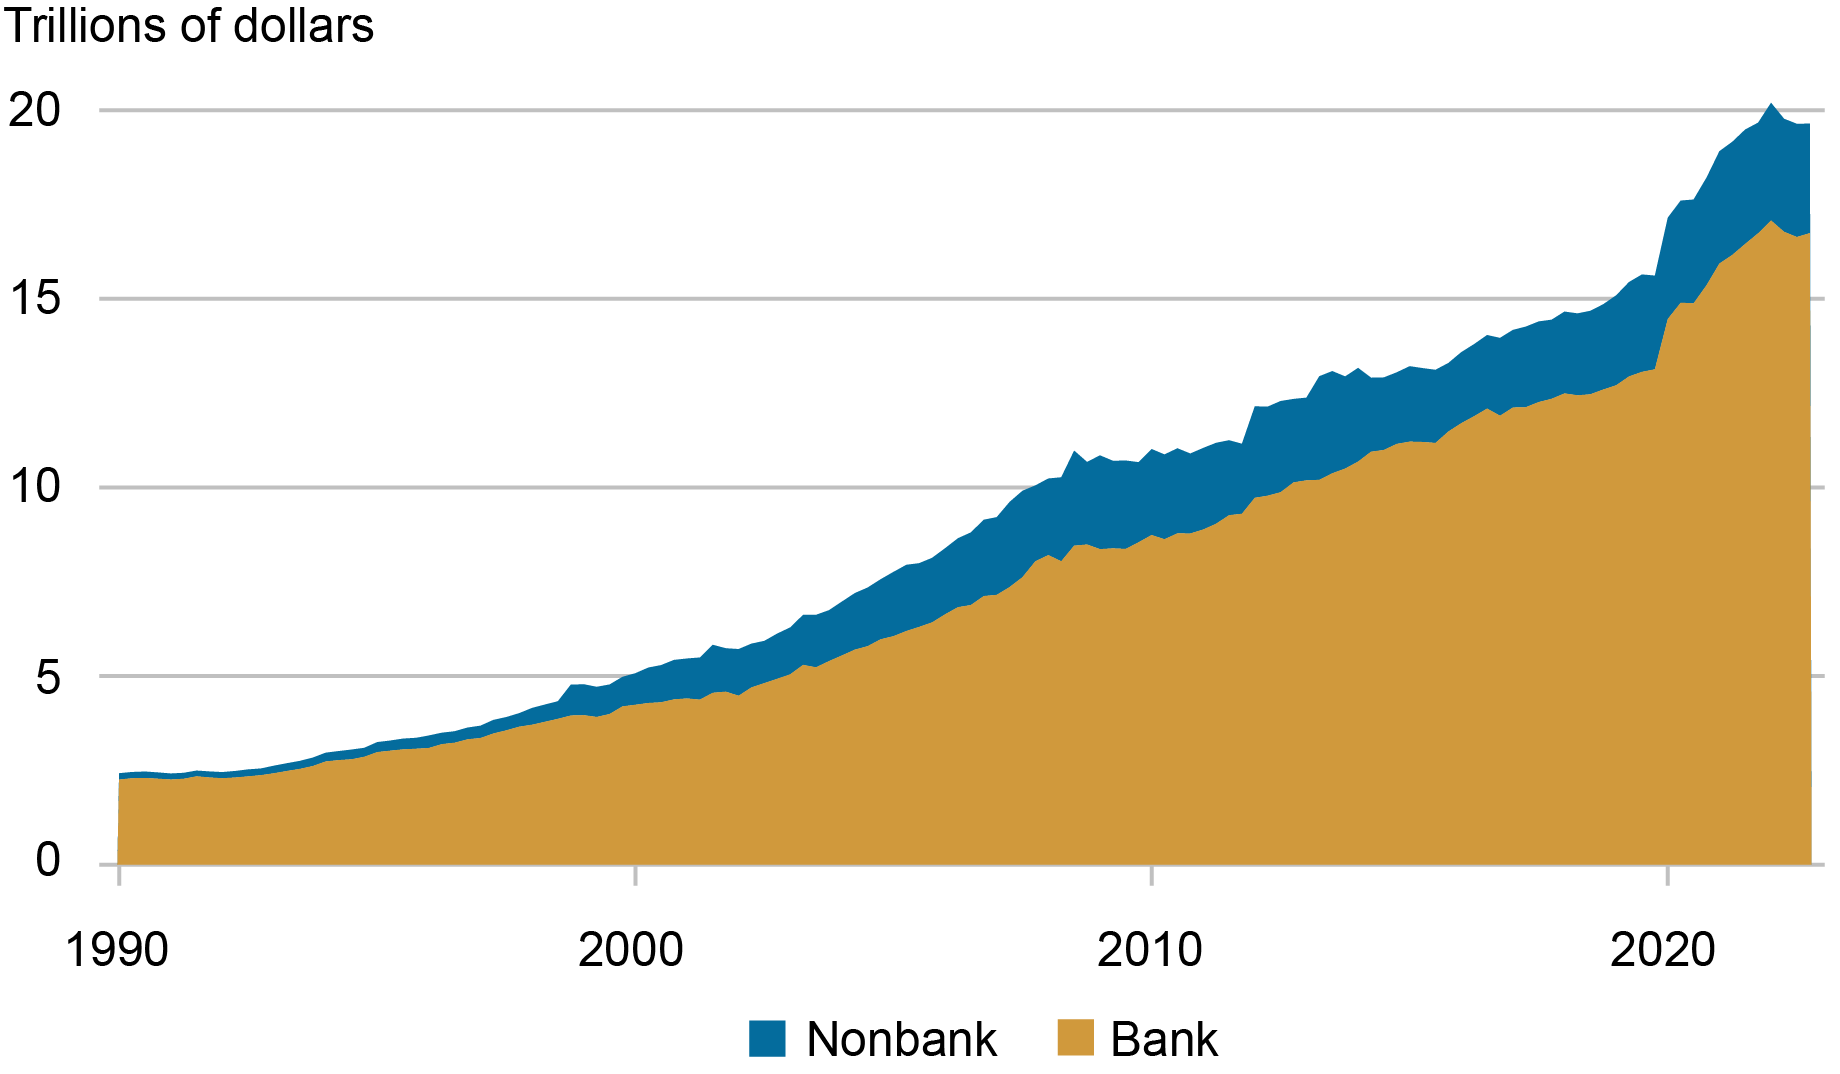
Sources: FR Y9-LP; FR Y9-C; FR Y-10; author’s calculations.
Note: We exclude the following BHCs: Goldman Sachs, Morgan Stanley, American Express, CIT Group, Ally Financial, Discover, M&T Bank, MetLife.
A similar picture appears when looking at the top 200 BHCs by operating revenues, defined as interest income plus noninterest income. In the next chart, we decompose BHC operating revenues, using nonbank operating revenue from the FR Y-9LP and total BHC operating revenue from the FR Y-9C (the consolidated balance sheet of BHCs). NBFIs’ share of total operating revenue has also been increasing over the years, representing approximately 21 percent of BHCs’ total operating revenue in 2022:Q4.
Composition of BHC Operating Revenue
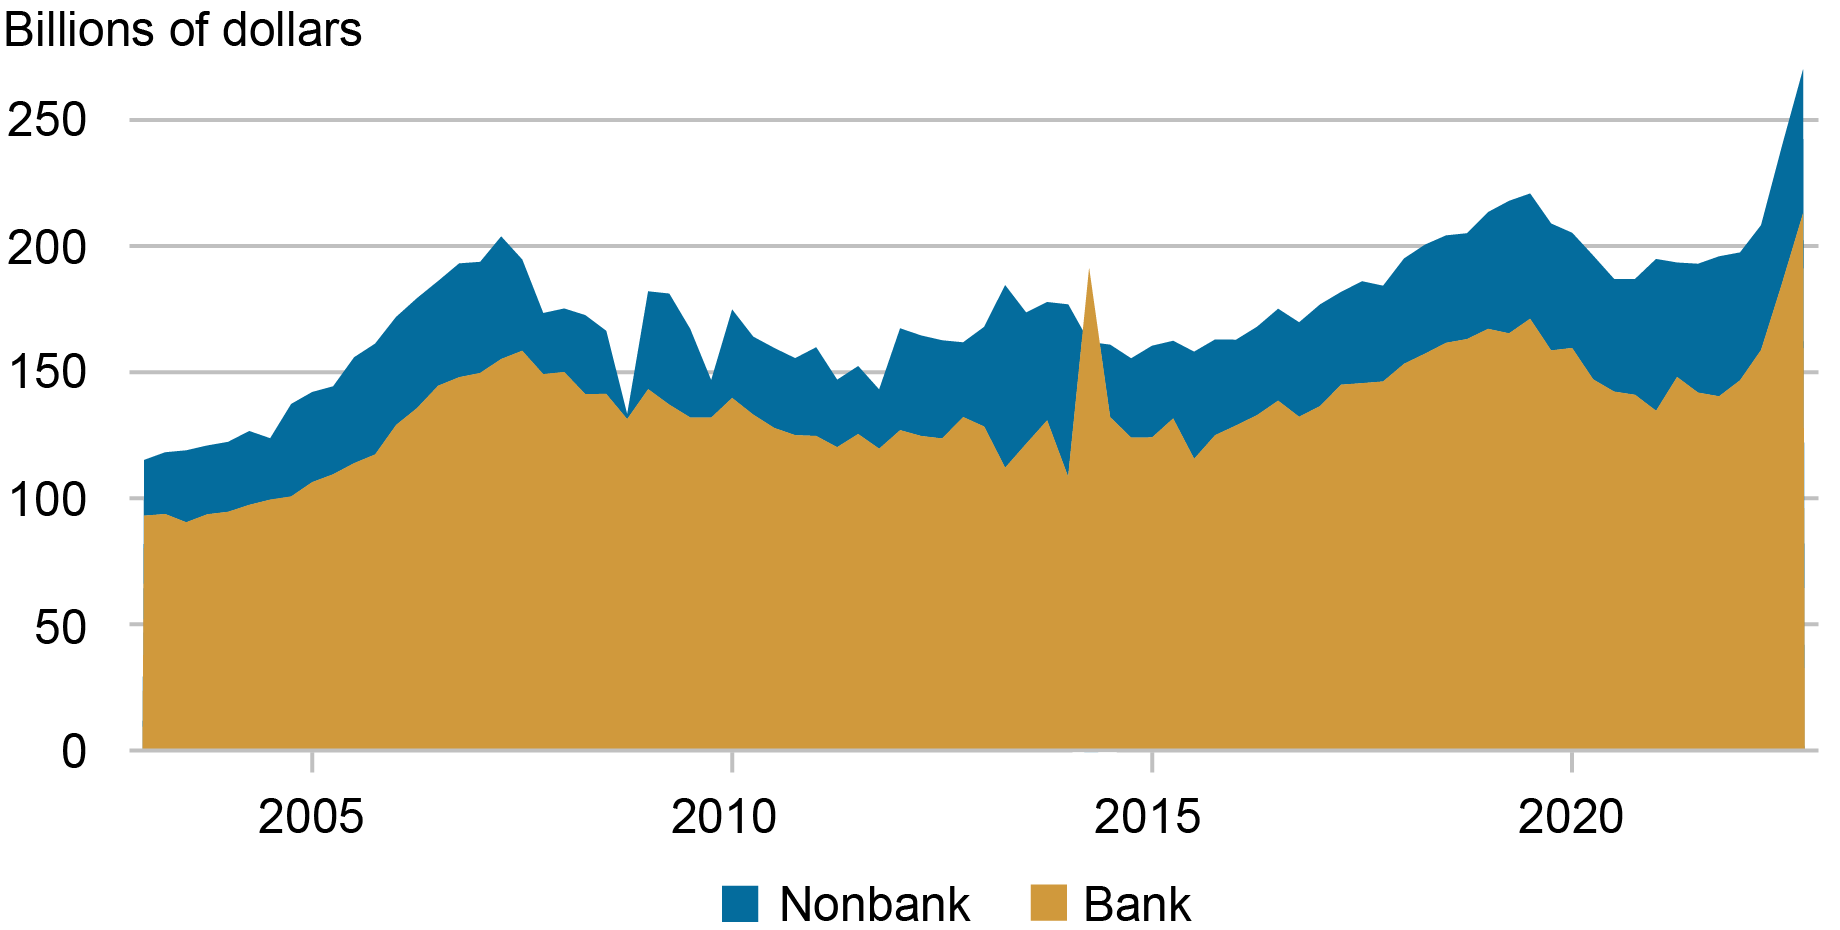
Sources: FR Y9-LP; FR Y9-C; FR Y-10; authors’ calculations.
Note: We exclude the following BHCs: Goldman Sachs, Morgan Stanley, American Express, CIT Group, Ally Financial, Discover, M&T Bank, MetLife.
While the evidence shows that NBFIs have had a significant role inside BHCs over the years, what is the relationship between NBFIs and “core” depository institutions? Did banking firms simply pursue a strategy of organizational diversification, or did they recognize the potential existence of conglomeration benefits between banks and NBFIs? In the latter case, ownership or controlling interests in both types of institutions may allow the exploitation of synergies, thus creating benefits for the organization as a whole.
To explore this issue, we consider the tiering structure inside each BHC in our database, which allows us to identify both the ultimate parent of a given subsidiary as well as the intermediate entities holding the subsidiary before the parent. In the diagram below, we show a stylized example of an organizational structure. The diagram establishes that “NBFI 1” is ultimately a subsidiary of the parent BHC and is directly owned by the depository institution “Bank 1,” which in turn is directly owned by the parent BHC.
Example of BHC Organizational Structure
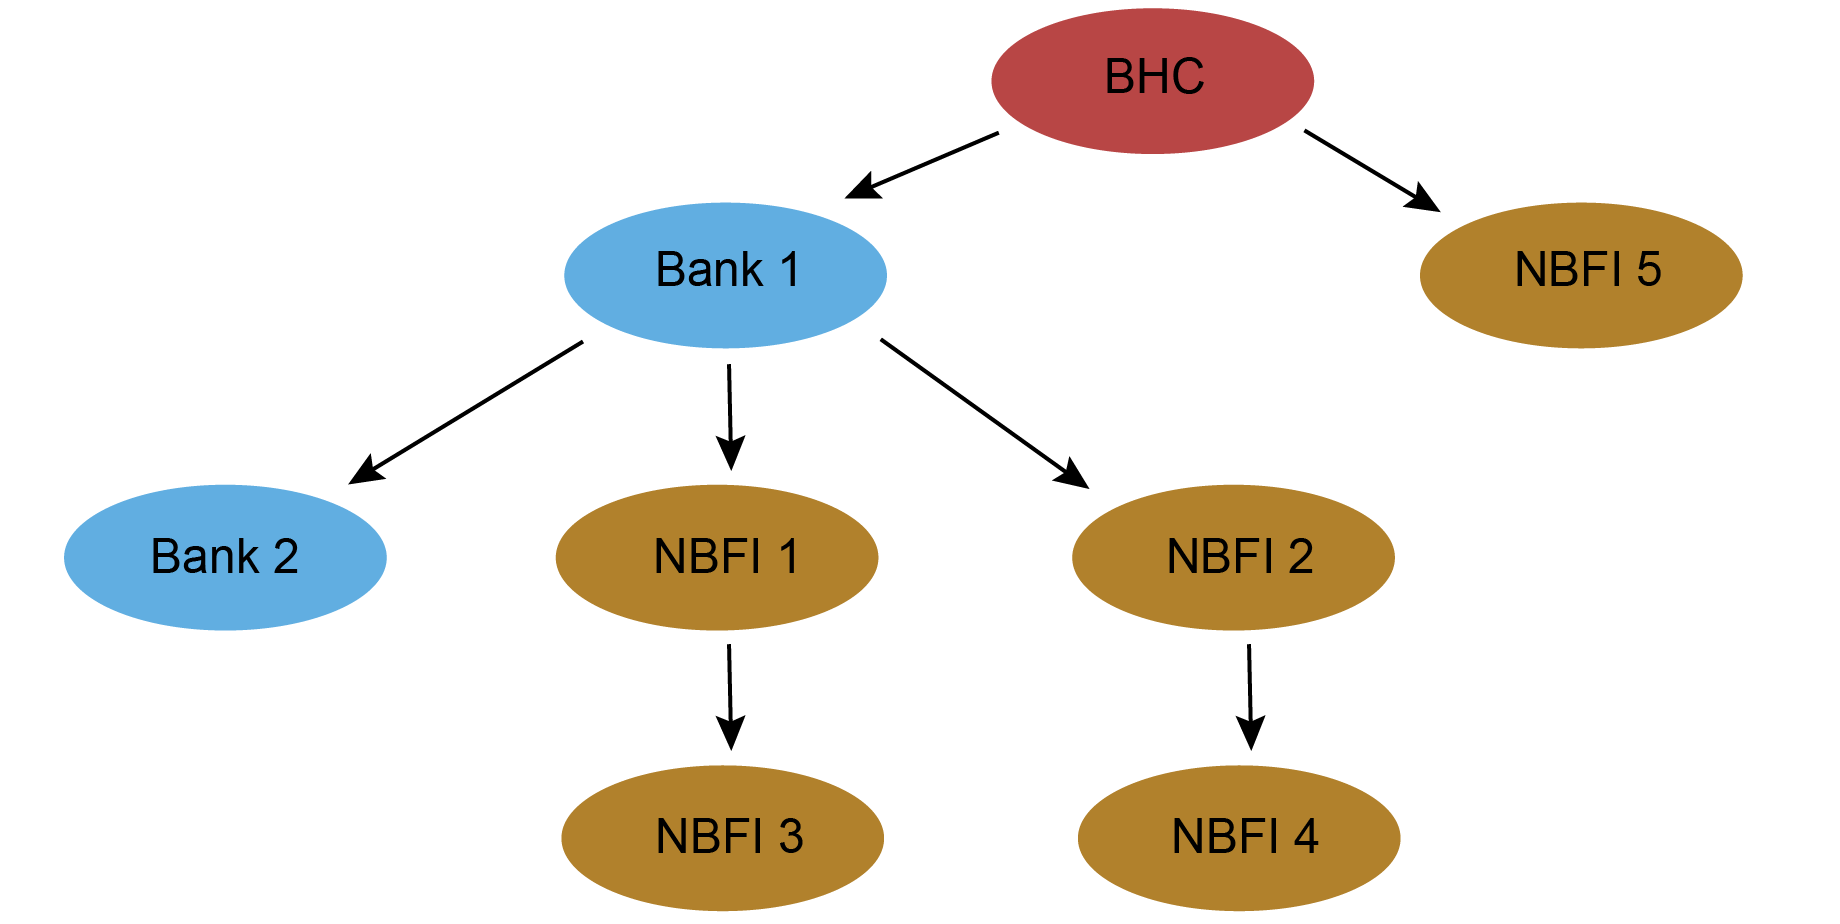
We argue that the decision to nest subsidiaries within internal control chains may reflect the capacity of those connected subsidiaries to generate conglomeration benefits. In particular, the extent to which depository institution subsidiaries of BHCs directly control NBFI subsidiaries (as “Bank 1” controls NBFIs 1-4) captures the extent to which the “core” components of a banking firm—the depository institutions—are closely connected to the nonbank side.
In the chart below, we show how the number of NBFI subsidiaries within the top 200 BHCs that are controlled by depository institutions, through both direct and indirect ownership, has evolved relative to the total number of NBFI subsidiaries under a BHC umbrella. We find that the number of nonbank subsidiaries nested under a depository institution, and thus part of a depository institution’s direct control chain within a BHC, has been quite substantial over the years. Nonbanks have cast a long shadow over core banking activities for a long time.
Composition of BHC Nonbank Subsidiaries by Control Chain
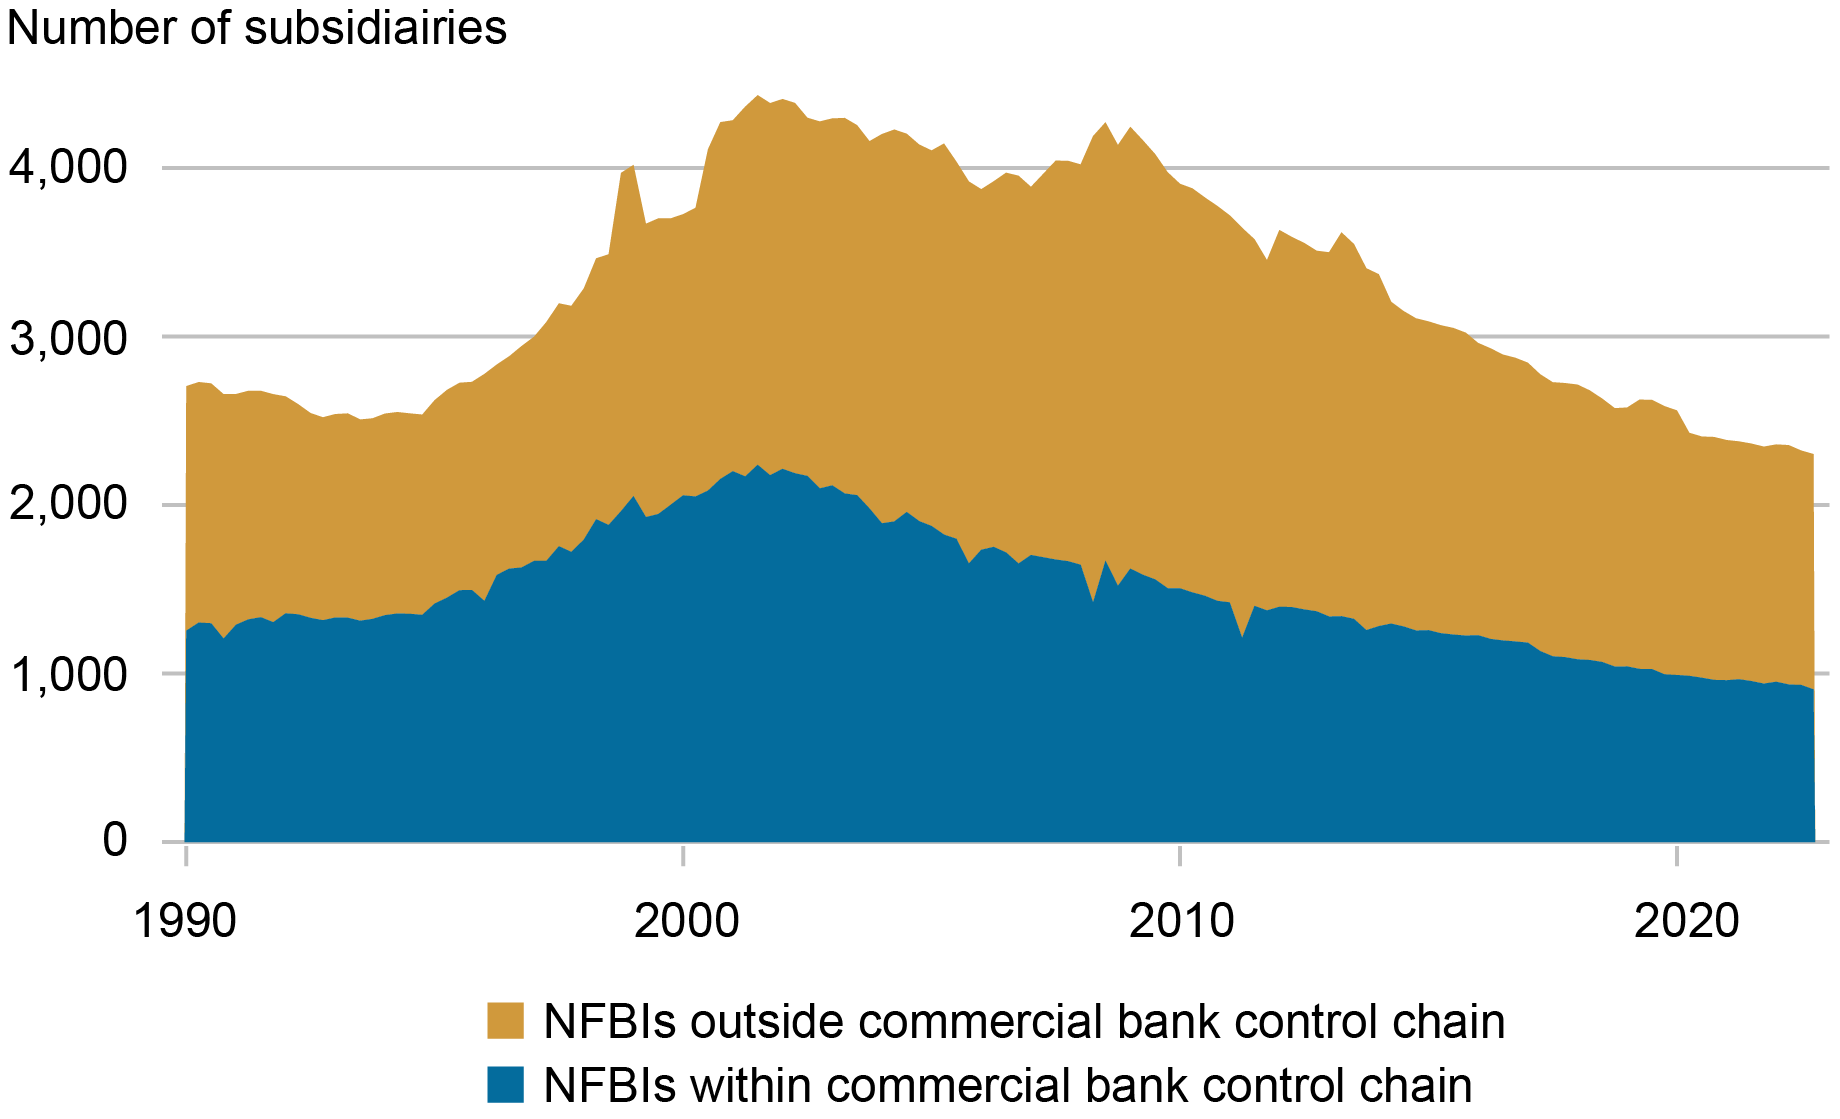
Sources: FR Y-10; authors’ calculations.
Note: We exclude the following BHCs: Goldman Sachs, Morgan Stanley, American Express, CIT Group, Ally Financial, Discover, M&T Bank, MetLife.
Nonbank Evolution and Living Wills
The same chart shows that, after the GFC, the count of NBFI subsidiaries decreases quite significantly. Interestingly, this trend reversal coincides with the largest BHCs becoming subject to resolution plans, or “living wills,” under the Dodd-Frank Act. Living wills forced banks to create a blueprint for how they could be resolved in bankruptcy without undue spillovers to the rest of the system. In particular, living wills are thought to have forced banks to create more organizational separation between depository institutions and nonbank activities. For example, Goldman Sachs in its 2015 living will submission writes: “We have established a number of criteria for a less complex and more rational legal entity structure with the goal of… protecting our insured depository institution from losses incurred by non-bank affiliates” (see page 15). However, given the history of banking firms adapting and evolving around regulatory boundaries, there is a chance that the bank-NBFI nexus we have identified may not have disappeared, but merely shifted to a different form. In a forthcoming paper, we investigate these questions at greater length, and we will report on our findings in subsequent posts.

Nicola Cetorelli is the head of Non-Bank Financial Institution Studies in the Federal Reserve Bank of New York’s Research and Statistics Group.

Saketh Prazad is a research analyst in the Federal Reserve Bank of New York’s Research and Statistics Group.
How to cite this post:
Nicola Cetorelli and Saketh Prazad, “The Nonbank Shadow of Banks,” Federal Reserve Bank of New York Liberty Street Economics, November 27, 2023, https://libertystreeteconomics.newyorkfed.org/2023/11/the-nonbank-shadow-of-banks/
BibTeX: View |


Disclaimer
The views expressed in this post are those of the author(s) and do not necessarily reflect the position of the Federal Reserve Bank of New York or the Federal Reserve System. Any errors or omissions are the responsibility of the author(s).
 RSS Feed
 Follow Liberty Street Economics