


A key feature of the post-pandemic inflation surge was the strong correlation among inflation rates across sectors in the United States. This phenomenon, however, was not confined to the U.S. economy, as similar inflationary pressures have emerged in other advanced economies. As generalized as the inflation surge was, so was its decline from the mid-2022 peak. This post explores the common features of inflation patterns in the U.S. and abroad using an extension of the Multivariate Core Trend (MCT) Inflation model, our underlying inflation tracker for the U.S. The Global MCT model purges transitory noise from international sectoral inflation data and quantifies the covariation of their persistent components—in the form of global inflation trends—along both country and sectoral dimensions. We find that global trends play a dominant role in determining the slow-moving and persistent dynamics of headline consumer price index (CPI) inflation in the U.S. and abroad, both over the pre-pandemic and post pandemic samples.
The Global Multivariate Core Trend Inflation Framework
We use the Global MCT for this Liberty Street Economics analysis to estimate the influence of global and domestic factors on inflation persistence in different countries, as well as to determine whether these factors affect all sectors at the same time or are concentrated in specific sectors. To this end, we apply our model to a dataset of seven countries (the U.S., the UK, the Euro Area, Canada, Japan, South Korea, and Mexico). For each country, the data are annualized monthly inflation rates for four sectors that span the CPI, namely: core goods, non-housing core services, housing, and food and energy. Our Global MCT model decomposes each country-sector inflation rate into trend and transitory/noise components. Each of these is then further decomposed into a component that is common across all countries and sectors, a sector-specific component common across countries, a country-specific component common across sectors within each country, and a residual idiosyncratic component. In sum, the Global MCT model combines the sectoral dimension of the New York Fed MCT model with the international perspective we explored in a previous post.
The Role of Global Trends for Headline CPI Inflation Persistence
The Global MCT returns three common factors as particularly important: one global common factor that affects all sectors and countries, which we call the Global Inflation Trend (GIT), and two sectoral global trends. Of these, the first is a global factor that affects core goods inflation in all countries (Core Goods Global Inflation Trend, or CG-GIT); the other is a global factor that affects food and energy inflation in all countries (Food and Energy Global Inflation Trend, or FE-GIT). Taken together, these factors explain most of the slow-moving and persistent dynamics of overall CPI inflation in the U.S. and abroad, as can be seen in the table below. In particular, and except for Japan, global factors explain up to 90 percent of the persistence of CPI inflation in advanced economies. By construction, the Global MCT aims to separate the transitory from the more persistent dynamics of inflation. Intuitively, the persistent component is what is more relevant from a policy perspective, as it signals inflationary pressures that are slower to die down. What the table shows is that in fact, the persistent component of U.S. CPI inflation is well-captured by factors that are not U.S.-specific, but rather shared across countries. Moreover, the estimated importance of global factors is not just a feature of the post-pandemic period but is rather a stable characteristic of international inflation data.
Global Trends Drive Inflation Persistence Across Countries, Both Pre and Post COVID-19
| | USA | EA | GBR | CAN | JPN | KOR | MEX |
|---|---|---|---|---|---|---|---|
| Pre-COVID (1990-2019) | |||||||
| Global Inflation Trend | 11.1 | 66.2 | 75 | 44 | 35.1 | 37.7 | 56.5 |
| [4.2, 24.3] | [58.1, 76.1] | [56.9, 85.6] | [21.5, 61.3] | [20.0, 56.5] | [17.3, 56.1] | [22.0, 84.8] | |
| Global Sectoral Trends | 86 | 33.2 | 21.7 | 54.3 | 14.5 | 42.2 | 15.6 |
| [67.4, 94.0] | [23.1, 41.4] | [11.9, 34.5] | [37.3, 74.2] | [6.1, 51.1] | [27.1, 64.5] | [2.5, 46.7] | |
| Post-COVID (2020-2024) | |||||||
| Global Inflation Trend | 13.3 | 73.8 | 77.2 | 50.5 | 43.7 | 47.4 | 75.7 |
| [4.5, 29.2] | [62.4, 83.5] | [55.2, 86.8] | [24.8, 69.1] | [25.0, 65.8] | [22.7, 66.3] | [42.6, 92.3] | |
| Global Sectoral Trends | 84.1 | 25.8 | 20.5 | 48.2 | 13.4 | 37.8 | 14.7 |
| [66.7, 94.1] | [15.9, 37.4] | [11.7, 39] | [29.6, 71.3] | [6.1, 46.6] | [22.6, 62.8] | [2.6, 45.0] |
Notes: The contributions are calculated as a share (expressed as percentages) of the variance of changes in the persistent component of each country’s headline CPI inflation rates. Numbers in square brackets are 95% credible intervals.
The Role of Global Trends for Sectoral Inflation Persistence
Each global trend plays a different role in the persistence of sectoral CPI inflation across countries. In particular, we find that while non-housing core services inflation is mostly explained by GIT (the factor common across all countries and sectors), to explain goods inflation and food and energy inflation we need the two additional sector-specific global trends (CG-GIT and FE-GIT). The chart below illustrates this point, by comparing country inflation data by sector alongside the corresponding global factor (the red line) that best captures its persistent dynamics. In the chart, the thin lines are moving averages of monthly sectoral inflation data of the seven countries, calculated as to remove high frequency movements.
There are three main takeaways from this chart. First, the strong commonality across sectoral inflation rates is quite visible: that motivates our quest for identifying global trends through the Global MCT. Second, the common fluctuations in inflation persistence across countries and sectors is a stable characteristic of international sectoral inflation rates at least since the early nineties, which is when our estimation sample begins. Third, goods inflation has a very strong international component. That this would be the case for food and energy inflation rates is perhaps expected. Most of food and energy inflation worldwide depends on the same global commodity prices. But it is surprising to see that this international dimension operates quite forcefully for core goods as well. Evidently, integration in product markets as well as the ever-increasing reliance on global supply chains binds core goods prices together across countries.
Most of the Variation in Inflation Persistence Is Global
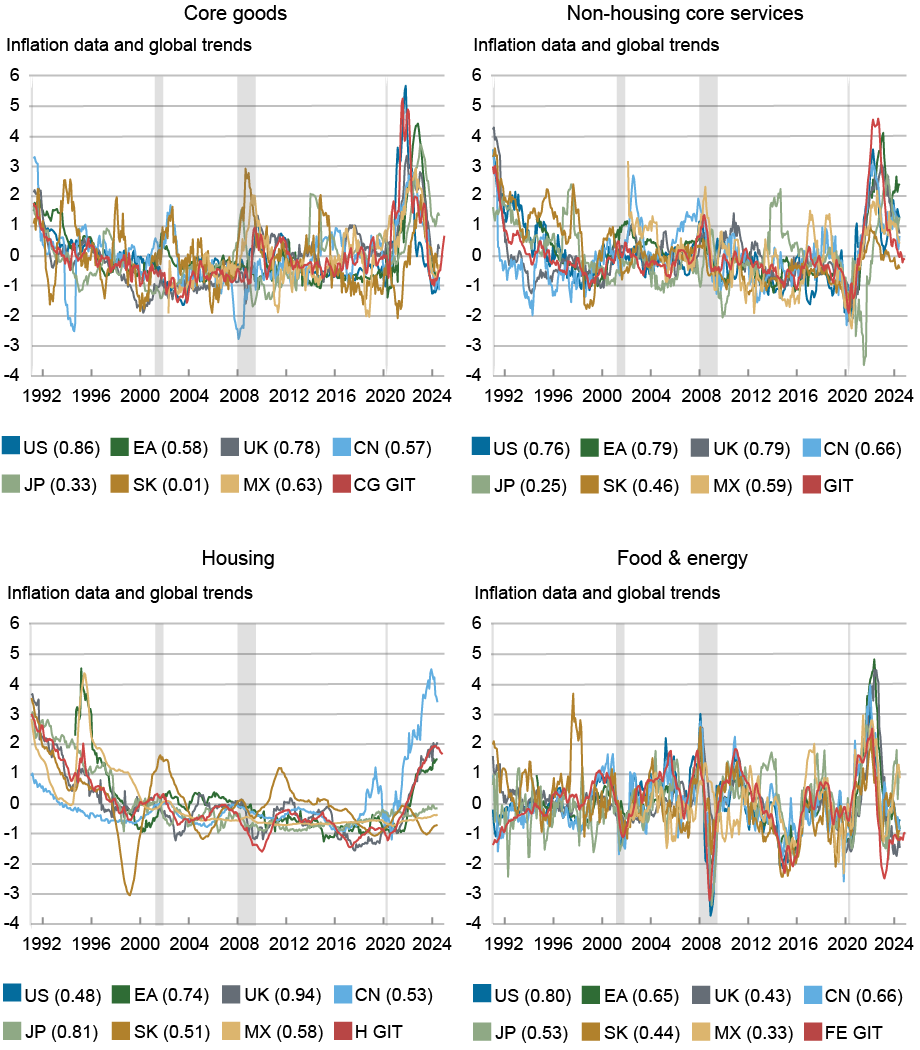
Notes: In each subplot, the thin lines are eleven-month, two-sided moving averages applied to the sectoral monthly inflation rate of a particular country. The red line represents one of the global inflation trends (GIT): In the core goods, housing, and food & energy panels, the red line is the corresponding sectoral GIT; In the non-housing core services panel, the red line is the common GIT. Each series is normalized to have mean zero and unit variance. The numbers in the legend are the correlations of each series with the related global trend.
U.S. Inflation’s Post-Pandemic Surge
We turn to focus more specifically on the post-pandemic inflation episode in the U.S. The next panel chart shows how much each of the global inflation trends have contributed to determine the persistence of U.S. sectoral CPI inflation since December 2019. The most striking feature emerging from the charts is that U.S.-specific components (the red bars) have played a rather negligible role in the overall trend. In turn, this suggests that they tend to be rather transitory, and hence not picked up by the trends estimated by the Global MCT model.
Otherwise, the post-pandemic snapshot confirms what was noted earlier. The evolution of the persistent component of U.S. core goods inflation (the top left panel) is dominated by the sectoral global factor CG-GIT, with the widespread effects of disruptions in global supply chains and international trade since 2020 being the likely culprits. Conversely, U.S. non-housing core services inflation (the top right panel) is fundamentally a GIT story.
The evidence for housing and food & energy is more mixed, in that more than one component play a significant role. For housing, the international sectoral trend (H-GIT) generally plays a trivial role but pops up as quite significant from 2022 onward (the lower left panel). This is likely due to our definition of housing inflation covering mostly rents. Our model naturally interprets the widespread increase in rents since the pandemic as a common sectoral factor. The sectoral global trend also captures the big swing in food & energy inflation (the lower right panel). This is very likely due to the sharp movements in energy prices that have affected multiple countries since the onset of the pandemic and have been reinforced since the Russian invasion of Ukraine in February 2022.
Global Factors Explain Most Movements in U.S. Inflation in the Post-Pandemic Period
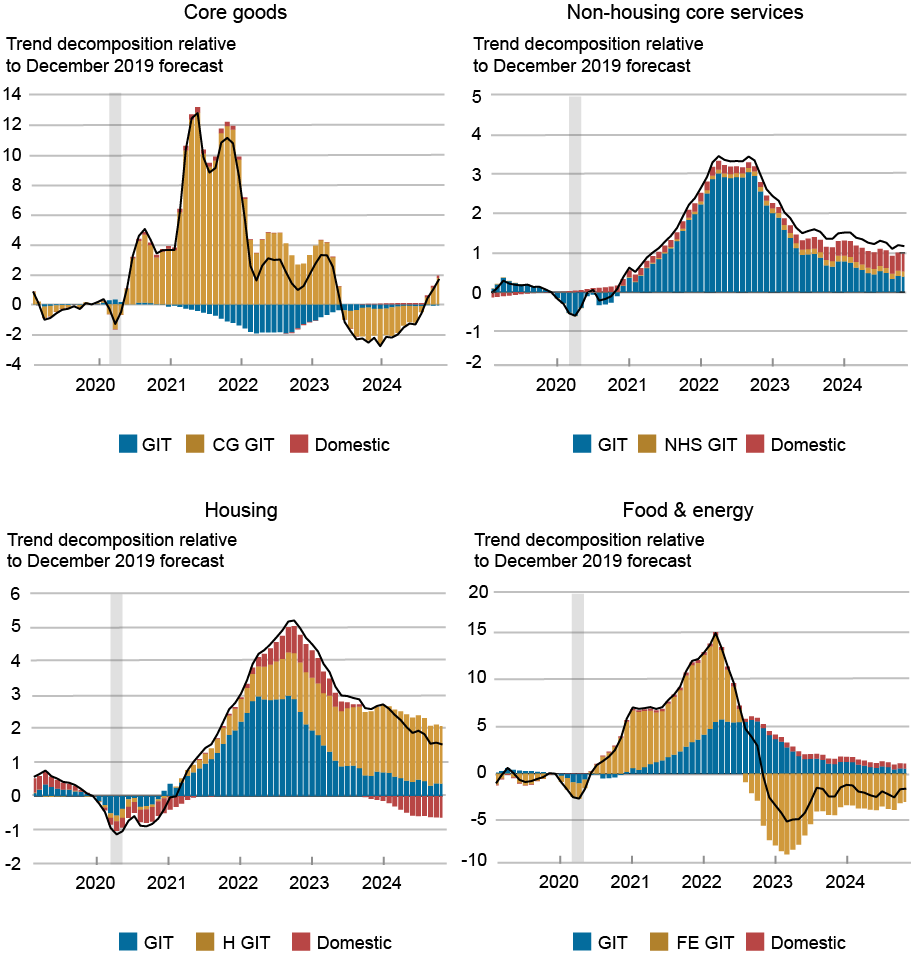
Notes: In each subplot, the solid line denotes the evolution of the persistent component of the sectoral inflation rate relative to December 2019. The bars denote the contribution of the common global inflation trend (GIT) (blue), the global sectoral trends (gold), and domestic trends (red).
Conclusion
In this post we have shown that once transitory movements are removed, international inflation rates display a very strong commonality. In other words, the slow-moving trends that we see in U.S. inflation rates are not U.S.-specific but are shared by other countries as well. Three global trends capture the bulk of the variation in inflation persistence across countries.
These findings leave us with an interesting question: what explains these global trends in the first place? Our next post will address this issue.

Ozge Akinci is head of International Studies in the Federal Reserve Bank of New York’s Research and Statistics Group.

Martín Almuzara is a research economist in the Federal Reserve Bank of New York’s Research and Statistics Group.

Silvia Miranda-Agrippino is a research economist in the Federal Reserve Bank of New York’s Research and Statistics Group.

Ramya Nallamotu is a research analyst in Macroeconomic and Monetary Studies in the Federal Reserve Bank of New York’s Research and Statistics Group.

Argia Sbordone is head of Macroeconomic and Monetary Studies in the Federal Reserve Bank of New York’s Research and Statistics Group.

Greg Simitian is a research analyst in International Studies in the Federal Reserve Bank of New York’s Research and Statistics Group.

William Zeng is a research analyst in International Studies in the Federal Reserve Bank of New York’s Research and Statistics Group.
How to cite this post:
Ozge Akinci, Martin Almuzara, Silvia Miranda-Agrippino, Ramya Nallamotu, Argia Sbordone, Greg Simitian, and William Zeng, “Global Trends in U.S. Inflation Dynamics ,” Federal Reserve Bank of New York Liberty Street Economics, February 27, 2025, https://libertystreeteconomics.newyorkfed.org/2025/02/global-trends-in-u-s-inflation-dynamics/
BibTeX: View |


Disclaimer
The views expressed in this post are those of the author(s) and do not necessarily reflect the position of the Federal Reserve Bank of New York or the Federal Reserve System. Any errors or omissions are the responsibility of the author(s).
 RSS Feed
 Follow Liberty Street Economics