


Amid increasing pressure on the Chinese economy from China’s trade conflict with the U.S., assessing the strength of the Chinese economy will be an important watch point. In this post, we provide an update on China’s recent economic performance and policy changes. While China is likely to counter growth headwinds from the escalating trade tensions with additional policy stimulus, the country’s complex fiscal dynamics and the varying interpretations of the strength of its economic growth made judgments of the efficacy of China’s policy response challenging even in a more predictable environment. In this respect, we argue that aggregate credit is a simple and effective measure to gauge policy stimulus in China. At present, China’s “credit impulse”—the change in the flow of new aggregate credit to the economy relative to GDP—appears likely sufficient to allow it to muddle through with steady but not strong growth over the next year despite the intensifying trade conflict.
China’s Recent Economic Headwinds
China’s economy has faced major headwinds since the beginning of 2020. Its pandemic-related lockdowns were the most protracted among major economies globally. Yet the most severe constraint on growth has been the collapse of the country’s property sector. This crisis had its beginnings in the summer of 2020 when Chinese authorities tightened borrowing requirements on property developers, which precipitated a default by a major developer (Evergrande) about a year later. Financial strains subsequently spread to a large swath of other developers, with attendant spillovers to creditors, suppliers, local governments, and households.
The downturn in the property sector—a sector that had contributed roughly one-quarter of GDP—has been severe, as illustrated in the chart below. Total sales and starts of new property construction have fallen by 60 percent and 70 percent, respectively, while the total floor area of active construction has fallen by 20 percent. Property prices, notwithstanding artificial support by government price controls, have fallen by a cumulative 16 percent.
China’s Property Sector Has Collapsed
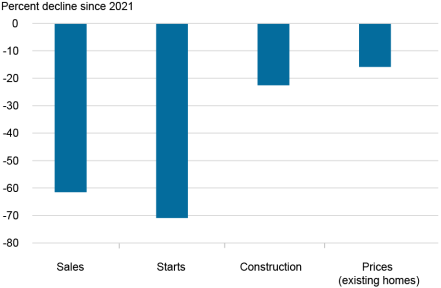
Notes: Sales, starts, and construction reflect the percent change in floor volume since December 2021. Prices are estimated from an index constructed by averaging the month-to-month percent changes of secondary market prices in major cities.
Economic Stimulus Has Been Modestly Effective
China responded to its economic downturn with forceful, albeit intermittent, stimulus. Policy stimulus started to ramp up around the time of Evergrande’s collapse in 2021 and included the full array of China’s policy toolkit. Among others, this included cuts to interest rates and banks’ required reserve ratios, increases in central government expenditures, loosening of macroprudential restrictions on home purchases, and an acceleration of industrial and credit policies to increase investment in industry and associated infrastructures. Beginning last September, the government doubled down on stimulus with a set of unprecedented and coordinated policy actions. Of note, in December the official characterization of China’s monetary-policy stance was changed from “prudent” to “moderately loose”—the first change in this language since the global financial crisis.
There is little consensus among analysts on how China’s economy has responded to this stimulus, in part reflecting long-standing skepticism over the accuracy of China’s economic statistics. Some commentary in the financial press paints a pessimistic picture—that China’s GDP has stagnated or even contracted—while the official picture and data show an economy where growth has averaged 4.5 percent over the past three years. Our view straddles these two sides: we think China’s economy has performed reasonably well despite the crisis in the property sector, but not as strongly as portrayed in official growth statistics.
As the left panel of the chart below shows, growth of real fixed asset investment reached multiyear highs by early 2023 despite a sharp contraction in real estate investment. This growth was supported by investment in manufacturing and infrastructure. These policies have made China less reliant on imports of manufactured goods even as its exports have remained strong, contributing to a surge in its merchandise trade surplus to nearly $1 trillion. The right panel of the chart compares China’s official GDP growth with an alternative estimate that incorporates a wide range of monthly data, using the method discussed in this paper. Both growth rates are benchmarked to the month of Evergrande’s initial default in 2021. This suggests alternative growth was likely slower than that shown in official statistics but not nearly as weak as claimed by more pessimistic assessments of China’s economy. The indicators in both panels also illustrate how the growth impulse appeared to sputter over the course of 2024, which triggered the expansion of stimulus toward the end of last year.
Investment Has Been Supported by Manufacturing and Infrastructure

Notes: Real fixed-asset investment is calculated using nominal investment and a deflator estimated by the authors. The chart shows the twelve-month percent change calculated from the official year-to-date twelve-month percent change.
GDP Growth Has Been Moderately Slower Than Reported

Notes: The vertical axis shows the twelve-month percent change. Alternative growth is estimated using the method described in “Alternative Indicators for Chinese Economic Activity Using Sparse PLS Regression,” Jan J. J. Groen and Michael B. Nattinger, Federal Reserve Bank of New York Economic Policy Review 26, no. 4, October 2020.
What Is Holding the Economy Back?
China has muddled through a property crisis, but why hasn’t growth been stronger given the degree of stimulus? We argue that, while weak household consumption, increases in loss-making “zombie” firms and bad bank debt, and policy missteps in addressing the property crisis have all weighed on growth, the primarily contributor has been the limitations on the country’s fiscal space—the room in China’s general government budget to conduct fiscal policy without jeopardizing fiscal or financial stability.
Assessment of fiscal space in China is difficult because the nation’s fiscal accounts are among the least transparent in the world and its institutional framework is complex. Fiscal and monetary policies in China are tightly linked via “quasi-fiscal operations.” Quasi-fiscal refers to activities performed by financial and nonfinancial entities (such as banks, nonbank financial institutions, and government-affiliated or -owned enterprises) that serve a fiscal purpose. Fiscal policy in China is also extraordinarily decentralized, with more than four-fifths of general government expenditure responsibilities at the local level. This implies that assessments of the fiscal stance must focus on the consolidated general government, including the central, provincial, and sub-provincial levels (“local government”). Financing for local governments is highly reliant on opaque third-party entities, referred to as “local government financing vehicles” (LGFVs), and local government land sales.
Since 2014, the International Monetary Fund (IMF) has published annual estimates of “augmented” fiscal data that essentially attempt to account for these types of issues. The IMF’s figures for 2023 show augmented local government debt as high as 93 percent of GDP, an increase of approximately 60 percentage points of GDP over the past ten years. The chart below plots the IMF’s estimate of the local government fiscal deficits (in the dashed red line) that have caused this increase in debt. These deficits have averaged an extremely large 10 percent of GDP.
Local Governments Face Tightening Budget Constraints
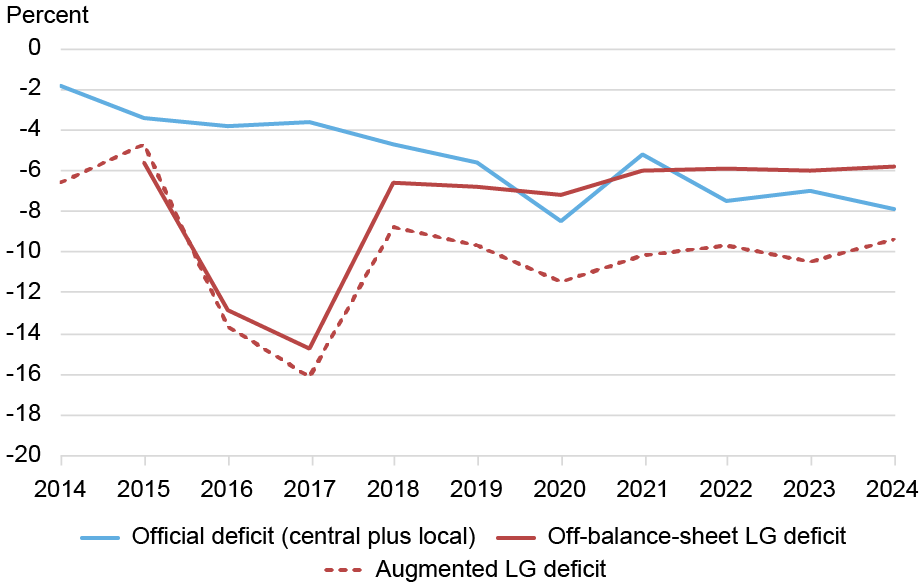
Notes: Official deficit is from published general public balances and fund balances. Local government (LG) data is from IMF Article IV documents: off-balance-sheet LG deficit is calculated from the change in LG implicit debt, while augmented LG deficit is calculated from the change in implicit and explicit debt.
While China’s government does not agree with the IMF’s numbers, it has recognized the severity of the fiscal situation at the local level and has started restructuring some of the LGFV debt and reining in new borrowing by these entities. At the same time, the government has moved more borrowing to official channels, as indicated by the path of the blue line in the chart above. This has shown increasing deficits even as large, local government deficits have declined modestly. On net, these policies have produced an on-again, off-again tightening of fiscal policy at the local level. While desirable from a fiscal sustainability perspective, this tightening has impaired the ability of policy stimulus to sustain growth.
Watch Credit to Understand the Growth Path
These complexities in China’s policy framework make it difficult to monitor the true stance of policy. In this context, we focus on the growth of aggregate credit as a simple rule of thumb that captures the quasi-fiscal nature of fiscal and monetary policy in China. For aggregate credit, we use China’s official measure of broad credit, which includes shadow finance, but we strip out equity issuance and loan write-offs. A useful metric in this regard is the credit impulse, which can be combined with more widely followed metrics such as growth rates of aggregate credit or bank loans. As highlighted in the chart below, the credit impulse has shown smaller increases than during previous credit cycles, reflecting the authorities’ more cautious stance on local government borrowing, a reluctance to return to the “flood style” credit expansion of past cycles and growing financing constraints in the banking sector. The credit impulse dipped modestly into negative territory in late 2024 and appears to be turning up again through the first quarter of 2025. The impulse appears likely to continue to increase this year given the magnitude of the trade conflict at present.
China Uses Credit Policy to Manage Growth

Notes: Aggregate credit (also known as “total social finance”) is a broad measure of credit that includes bank loans, central and local government bonds, and various measures of shadow finance. The chart shows the twelve-month change.
Credit growth has a strong relationship to China’s economic growth. The left panel of the chart below shows the response of China’s GDP growth to a one percentage point of GDP credit impulse, as measured by the alternative indicator shown in the earlier chart. This chart highlights how credit impulses, typically, have driven positive responses to GDP growth in China. This is not surprising given the large role of credit in the economy. Moreover, these credit impulses have also had significant spillovers historically to global trade, commodity, and foreign exchange markets—reflecting China’s size in the global economy.
Credit Impulse Boosts GDP Growth
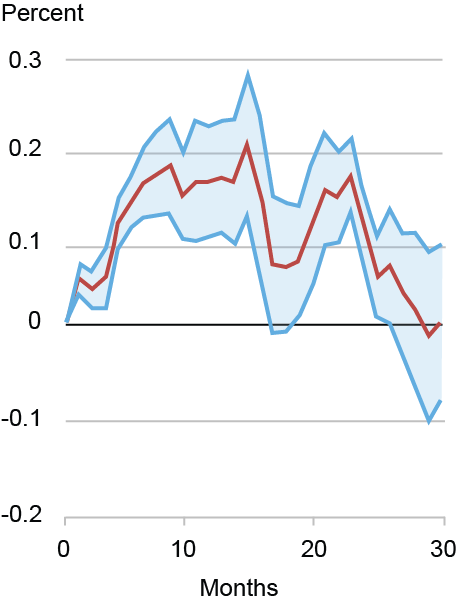
Notes: The chart shows the local projections impulse response from a 1 percent of GDP aggregate credit (TSF) stimulus on China’s GDP. The vertical axis shows twelve-month percent changes and the horizontal axis shows the number of months following the stimulus.
“Moderately Loose” Monetary Policy Could Boost the Credit
Impulse Substantially

Note: The hypothetical scenario for the aggregate credit impulse assumes that monthly credit growth returns to 2023 levels.
Additional Considerations
Expectations are that Chinese authorities will continue to adjust stimulus policies to maintain a relatively stable economic growth trajectory in the face of heightened and fluid trade tensions. The right panel in the chart above illustrates what likely would happen to the credit impulse if the shift to “moderately loose” monetary policy corresponded with monthly aggregate credit growth returning just to the moderately stimulative levels of 2023. The resulting credit impulse would be substantial, boosting GDP growth by 0.5 to 1 percentage point, holding all else equal. While plausible, this would only perpetuate China’s decades-long overreliance on industrial-led growth at the expense of a shift toward greater focus on consumption highlighted in a recent Liberty Street Economics post.

Jeffrey B. Dawson is an economic policy advisor in the Federal Reserve Bank of New York’s Research and Statistics Group.

Hunter L. Clark is an economic policy advisor in the Federal Reserve Bank of New York’s Research and Statistics Group.
How to cite this post:
Jeffrey B. Dawson and Hunter L. Clark, “Gauging the Strength of China’s Economy in Uncertain Times,” Federal Reserve Bank of New York Liberty Street Economics, April 24, 2025, https://libertystreeteconomics.newyorkfed.org/2025/04/gauging-the-strength-of-chinas-economy-in-uncertain-times/
BibTeX: View |


Disclaimer
The views expressed in this post are those of the author(s) and do not necessarily reflect the position of the Federal Reserve Bank of New York or the Federal Reserve System. Any errors or omissions are the responsibility of the author(s).
 RSS Feed
 Follow Liberty Street Economics