


As in previous years, we provide in this post an update on the vulnerability of the U.S. banking system based on four analytical models that capture different aspects of this vulnerability. We use data through 2025:Q2 for our analysis, and also discuss how the vulnerability measures have changed since our last update one year ago.
How Do We Measure Banking System Vulnerability?
We consider the following measures to capture key dimensions of banking system vulnerability, based either on analytical frameworks developed by New York Fed staff or adapted from academic research. The four measures were originally introduced in a Liberty Street Economics post in 2018 and have been updated annually since then, with a revision of the methodology implemented in 2023. The analysis uses publicly available regulatory data on bank holding companies.
The four measures aim to capture capital, fire sale, liquidity, and run vulnerabilities—and the way in which they interact to amplify negative shocks. The chart below shows the evolution of these measures.
Capital Vulnerability Indexes
Capital gap (billions of dollars)
Fire-Sale Vulnerability Index
Fraction of capital at risk
Liquidity Stress Ratio
Ratio of liquid liabilities to liquid assets
Run Vulnerability Index
Critical fraction of unstable funding
Source: Authors’ calculations, based on FR Y-9C reports.
Capital Vulnerability Indexes
These two indexes measure how well-capitalized the banks are projected to be after a severe macroeconomic shock. They are constructed using the CLASS model, a top-down stress-testing model developed by New York Fed staff. The indexes measure the capital gap, defined as the aggregate amount of capital needed under a macroeconomic scenario to bring each bank’s Tier 1 common equity capital to at least 10 percent of its risk-weighted assets.
We calculate the Capital Vulnerability Indexes under two macroeconomic scenarios: one that replicates the conditions experienced during the 2007-09 financial crisis (“2008 redux”) and one that replicates the conditions experienced during the 2022 rise in interest rates (“2022 redux”). In the second scenario, unrealized gains and losses on securities held in the AFS (“available for sale”) and HTM (“held to maturity”) portfolios are fully reflected in banks’ capital levels. Both indexes are stable and, if anything, have improved over the last four quarters: based on the “2008 redux,” the capital gap now stands at $1.92 billion (down from $5.1 billion in 2024:Q2), while based on the “2022 redux,” the gap is now $161.32 billion (down from $260.47 billion in 2024:Q2). Banks’ capital ratios, high by historical standards, are an important driver of this dynamic.
The chart below documents the decomposition of the Capital Vulnerability Indexes into two main components at any given point in time, namely the starting level of capital and the capital depletion during the projection period. Note that the starting level of capital, especially once unrealized gains and losses on securities are taken into account, has been improving since 2023 as both (1) the level of actual bank capital has improved (light blue line) and (2) the unrealized losses on securities have decreased (further pushing the red line up).
Decomposition of the Capital Vulnerability Index
Ratio of capital to risk-weighted assets (percent)
Fire-Sale Vulnerability Index
This index, based on the Journal of Finance article “Fire-Sale Spillovers and Systemic Risk,” captures the vulnerability of banks to a hypothetical system-wide asset fire sale. The scenario assumes a uniform shock to all asset values, incentivizing banks to sell assets in order to reduce their leverage. The spillover losses, resulting from the price impact of the asset sales, are calculated as a fraction of banks’ Tier 1 capital. Given the experience of March 2023, the methodology uses the “fair value” for all securities and adjusts bank capital for unrealized losses (or gains). This adjustment increases leverage and therefore fire-sale vulnerability in periods of notable unrealized losses, due, for example, to rising interest rates.
The Fire-Sale Vulnerability Index is roughly level compared to the previous annual update. The index has been on an unsteady decreasing trend since increasing sharply starting in 2022:Q1 and peaking in 2022:Q3 at a level last seen in 2009 (see the first chart in this post). Since then, the index has retraced more than half of its increase and has been at a moderate level by historical standards, but it remains elevated compared to the low levels observed between 2015 and 2022. The chart below decomposes the index into the size of the banking system (relative to the rest of the financial sector), its leverage, and its “connectedness” (capturing the commonality of asset liquidity, leverage, and size across banks). Both the increase in the index in 2022 and the decrease since then have been driven mainly by changes in leverage, measured at fair value.
Decomposition of the Fire-Sale Vulnerability Index
Normalized to 100 in 2006:Q1
Liquidity Stress Ratio
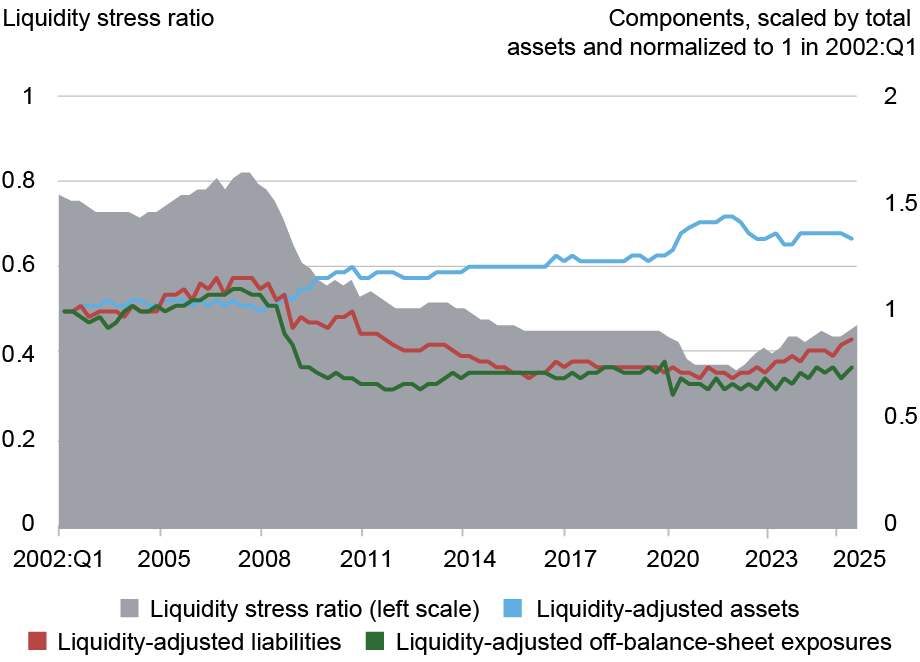
This ratio measures the potential liquidity shortfall of banks under conditions of liquidity stress as captured by the mismatch between liability-side (and off-balance-sheet) liquidity outflows and asset-side liquidity inflows. For each individual bank, it is defined as the ratio of runnability-adjusted liabilities plus off-balance-sheet exposures to liquidity-adjusted assets. The liabilities are adjusted for runnability by weighting each exposure category by its expected outflow rate, while the assets are adjusted for liquidity by weighting each asset category by its expected market liquidity. The liquidity stress ratio grows when expected funding outflows increase or assets become less liquid. Following the events of March 2023, the methodology accounts for unrealized losses or gains on all securities by using the fair value method, which implies an increase in the ratio when assets depreciate—due, for example, to rising interest rates. The aggregate ratio is computed as a size-weighted average of the individual banks’ liquidity stress ratio.
The first chart in this post shows that the liquidity stress ratio is somewhat above the level of the previous annual update. The ratio has been on an increasing trend since 2022:Q1 and currently stands at its pre-pandemic value. Nevertheless, it is moderate by historical standards, being roughly half of the 2007:Q3 peak but above the low levels of 2020–21. The chart below plots the underlying components of the liquidity stress ratio. The significant rise in the ratio since early 2022 has been driven by a decline in liquid assets, coupled with an increase in unstable funding and off-balance-sheet exposures.
Decomposition of the Liquidity Stress Ratio
Run Vulnerability Index
This measure gauges a bank’s vulnerability to runs, taking into account both the bank’s liquidity and its solvency. We assume that a shock to assets and a concurrent loss of funding forces costly asset liquidations. Consequently, a bank can become insolvent due to a sufficiently bad asset shock, a sufficiently large loss of funding, or both. An individual bank’s run vulnerability is measured as the minimum fraction of unstable funding that the bank needs to retain in the stress scenario to prevent insolvency. The aggregate index is computed as a size-weighted average of the individual banks’ run vulnerabilities. This methodology also uses the fair value for all securities, which results in higher values of bank leverage in the period since early 2022.
The Run Vulnerability Index is at similar levels as during the previous annual update. Since increasing sharply starting in 2022:Q1 and peaking in 2022:Q3 at a level last seen in 2012, the index has not shown a clear trend. Run vulnerability is currently moderate by historical standards but remains elevated compared to the low levels between 2015 and 2022. Considering the underlying components of run vulnerability (see the chart below), we see that the increase in the index since early 2022 is mainly due to an increase in leverage, but the other components (unstable funding and illiquid assets) have also increased over this period.
Decomposition of the Run Vulnerability Index
Normalized to 0 in 2002:Q1
Final Words
Our measures present a mixed picture of trends in banking system vulnerabilities in recent years. While uniformly lower than the high levels seen in the run-up to the 2008–09 financial crisis, some of the measures have been higher in recent years than the low levels attained between 2015 and 2020.

Matteo Crosignani is a financial research advisor in the Federal Reserve Bank of New York’s Research and Statistics Group.

Thomas M. Eisenbach is a financial research advisor in the Federal Reserve Bank of New York’s Research and Statistics Group.

Fulvia Fringuellotti is a financial research economist in the Federal Reserve Bank of New York’s Research and Statistics Group.
How to cite this post:
Matteo Crosignani, Thomas Eisenbach, and Fulvia Fringuellotti, “Banking System Vulnerability: 2025 Update,” Federal Reserve Bank of New York Liberty Street Economics, November 4, 2025, https://doi.org/10.59576/lse.20251104
BibTeX: View |

Disclaimer
The views expressed in this post are those of the author(s) and do not necessarily reflect the position of the Federal Reserve Bank of New York or the Federal Reserve System. Any errors or omissions are the responsibility of the author(s).
 RSS Feed
 Follow Liberty Street Economics