


Understanding how short- and long-term assets are priced is one of the fundamental questions in finance. The term structure of risk premia allows us to perform net present value calculations, test asset pricing models, and potentially explain the sources of many cross-sectional asset pricing anomalies. In this post, I construct a forward-looking estimate of the term structure of risk premia in the corporate bond market following Jankauskas (2024). The U.S. corporate bond market is an ideal laboratory for studying the relationship between risk premia and maturity because of its large size (standing at roughly $16 trillion as of the end of 2024) and because the maturities are well defined (in contrast to equities).
Extracting Risk Premia from Yields
The forward-looking nature of yields, combined with the rich literature on expected default probabilities (Campbell, Hilscher, and Szilagyi [2008]; Feldhütter and Schaefer [2018]), allows us to extract expected returns without relying on historical price information. This feature provides powerful empirical advantages because in short historical samples realized returns may be driven by a few recessionary periods (for example, the Global Financial Crisis), structural shifts in the risk-free rate, or time-variation in risk premia, thereby biasing estimates of short- and long-duration returns.
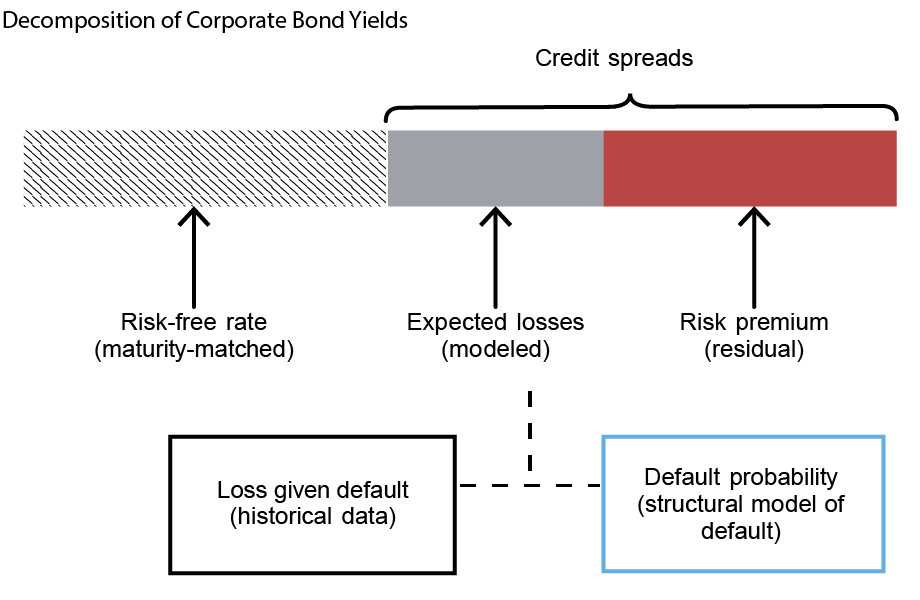
The key input in the risk premium calculations is the expected default loss component. The corporate bond yield is composed of three main parts, as depicted in the figure below: the maturity matched risk-free rate, expected default losses, and a risk premium. The latter two components constitute credit spreads, which are directly observable in the data. The expected default component is estimated using a structural model of default following Feldhütter and Schaefer (2018), along with historical data on loss given default. The advantage of using a structural model to construct expected losses is that it provides ex-ante time-varying measures of risk premia for a wide range of maturities and firms. The resulting time-series and cross-sectional patterns can shed light on how investors price different types of risk.
Duration Varies Substantially Across Corporate Bonds
Corporate bonds display substantial variation in duration, ranging from just a few years to over fifteen years, as shown in the chart below. This duration dispersion is useful because it allows for the construction of duration-based bond portfolios that diversify idiosyncratic risk and isolate the effects of duration. I form these portfolios as of June each year and keep their composition fixed for a year. The average duration of such portfolios is reported in the table. The shortest-duration portfolios have an average duration of only one to two years, whereas the longest-duration decile has an average duration closer to fourteen years. These values serve as reference points when referring to short- and long-duration risk premia in the subsequent analysis.
Distribution of Bond-Month Observations Across Maturity and Duration
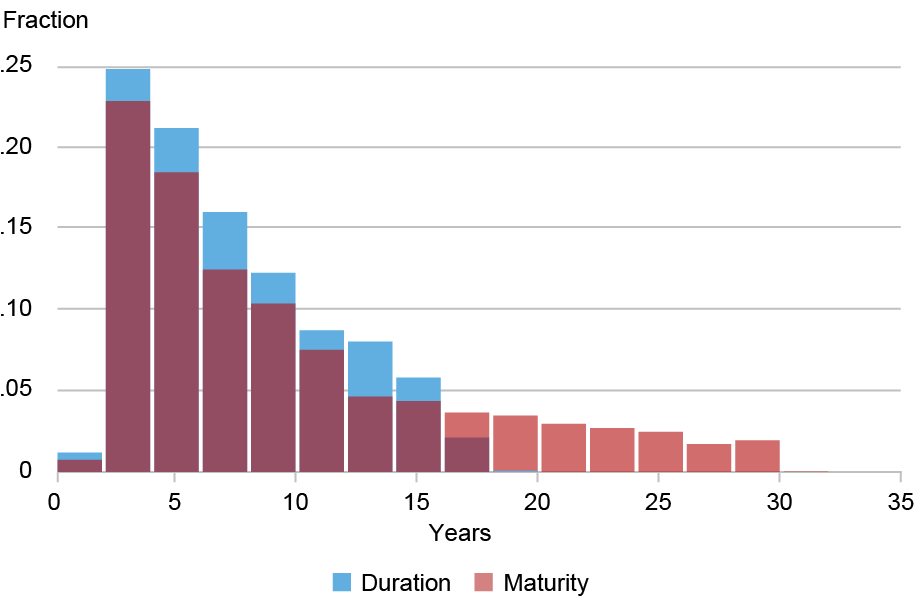
Notes: The chart presents the distribution of the data sample (2002-20) monthly observations by duration and maturity. The duration is measured using the standard Macaulay duration commonly used in the corporate bond literature. Bonds with maturities less than one year or above thirty years are excluded. The dark red bars are where the two histograms overlap.
Average Duration in Duration Deciles
| Low | 2 | 3 | 4 | 5 | 6 | 7 | 8 | 9 | High | High-Low |
|---|---|---|---|---|---|---|---|---|---|---|
| 1.3 | 2.4 | 3.4 | 4.2 | 5.1 | 6.0 | 7.1 | 8.8 | 11.5 | 14.1 | 12.7 |
Notes: The table reports the average durations of corporate bonds in the data sample (2002-20) sorted each June into duration deciles. Bonds with maturities less than one year or above thirty years are excluded.
The Slope of the Risk Premia Term Structure
The next chart presents the decomposition of yields into the risk premium, credit loss, and risk-free rate components across the different duration portfolios. The average term structure of yields is upward-sloping, with most of the slope concentrated between portfolios 1 and 5 and driven primarily by the upward slope of the risk-free rate (depicted in gold). In contrast, the credit spreads, that is, the sum of the blue and red areas, are somewhat hump-shaped.
My analysis decomposes the credit spreads using a structural default model. The main finding is that the term structure of the risk premium is upward sloping (depicted in blue). Since the average risk-free rate term structure also has a positive slope, the total expected returns are strongly upward-sloping, yielding a term premium of roughly 3.4 percent. Most of this term premium is driven by the slope of the risk-free rate (2.1 percent), but a substantial part comes from the slope of the risk premia (1.3 percent). Importantly, the contribution of the risk premium is economically meaningful: it constitutes up to 20 percent of long-term bond yields, and up to 30 percent of total expected returns (the sum of the risk-free rate and the risk premium). The positive risk premia slope is consistent with classical habit and long-run risk models, which link asset maturity to higher risk exposure.
Risk-Free Rate and Risk Premium Term Structures Are Both Upward Sloping
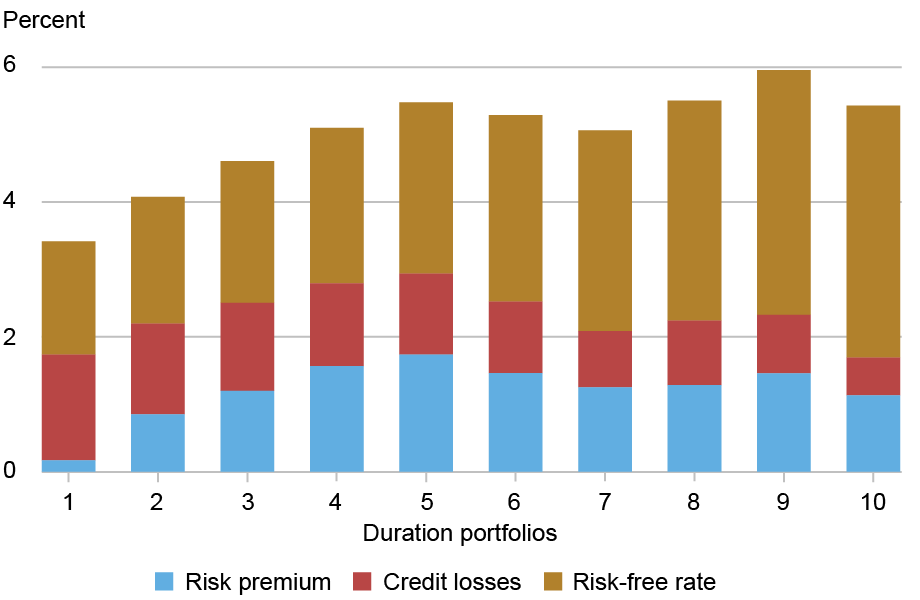
Notes: The chart presents the average yields, credit spreads, and decomposition of credit spreads into the risk premia and credit losses components by duration decile based on the structural default model of Feldhütter and Schaefer (2018).
The absolute size of risk premia falls well within a reasonable economic magnitude. Short-term bonds, with durations of one to two years, carry a premium close to 0 percent. This modest short-term risk premium indicates that investors do not treat corporate bonds strikingly differently from short-term government bonds, despite corporate bonds’ substantial heterogeneity. At longer horizons, the risk premium is much more substantial: it peaks at around 1.8 percent at intermediate horizons (four to six years) and levels off at approximately 1.5 percent for the longest duration portfolios (twelve years and more). This nonlinear effect is largely driven by the fact that most long-term bonds are issued by the safest issuers.
At first glance, the risk premia may appear small, especially if one compares them with the equity term structure estimates of 10-20 percent reported in Weber (2018). Part of the difference arises because the bond returns are net of the maturity-matched risk-free rate. In addition, the equity risk premium arguably reflects compensation for upside risks, to which bonds have limited exposure.
Conclusion
In this post, I quantify the shape of the forward-looking term structure in the U.S. corporate bond market. Overall, the evidence from the market highlights that risk premia, while modest in absolute size, play a meaningful role in shaping the term structure of returns. The upward-sloping profile of both the risk-free rate and the risk premium generates a sizeable term premium, with the latter accounting for a nontrivial share of long-term yields. These findings suggest that the corporate bond market provides a good laboratory for studying how investors are rewarded with different types of risk, offering valuable insights into both asset pricing theory and practical portfolio allocation.

Tomas Jankauskas is a financial research economist in the Federal Reserve Bank of New York’s Research and Statistics Group.
How to cite this post:
Tomas Jankauskas, “Estimating the Term Structure of Corporate Bond Risk Premia,” Federal Reserve Bank of New York Liberty Street Economics, February 24, 2026, https://doi.org/10.59576/lse.20260224
BibTeX: View |


Disclaimer
The views expressed in this post are those of the author(s) and do not necessarily reflect the position of the Federal Reserve Bank of New York or the Federal Reserve System. Any errors or omissions are the responsibility of the author(s).
 RSS Feed
 Follow Liberty Street Economics
Nice. It would be interesting to see the premia broken out for different rating categories – would that then remove the premium reduction in longer maturities entirely, or does demand from investors with long-duration liabilities still mean incremental premia go negative beyond some duration point?