Since the outbreak of the COVID-19 pandemic in late January, oil prices have fallen sharply. In this post, we compare recent price declines with those seen in previous oil price collapses, focusing on the drivers of such episodes. In order to do that, we break oil price shocks down into demand and supply components, applying the methodology behind the New York Fed’s weekly Oil Price Dynamics Report.
Historic Oil Price Collapses
The recent drop in oil prices has certainly been severe, but large oil price declines are hardly unprecedented. Over the past four decades, four such episodes stand out:
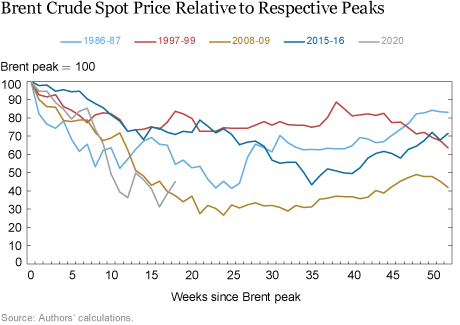
- 1986-1987: By 1985 OPEC’s share of world oil production had fallen to about 30 percent from 52 percent in 1973 (Fattouh, 2007), largely due to the rise of non-traditional oil production (North Sea oil exploration, for example). In order to regain market share, OPEC decided in 1986 to introduce a new pricing system and raised its production quota, resulting in a large oil price decline—about 50 percent—six months after the peak in Brent crude prices.
- 1997-1999: At an OPEC meeting in late 1997, the organization of oil producing countries decided to increase production quota for all its members (Mabro, 2009). This production increase came against a background of stagnant global demand owing to the aftermath of the Asian currency crisis in 1997 and deteriorating financial conditions by late 1998 on account of the collapse of the hedge fund Long Term Capital Management. Brent crude prices dropped around 30 percent by the thirteenth week of the selloff and remained there for a large part of 1998 until prices dropped an additional 10 percent.
- 2008-2009: By the fall of 2008, the demand contraction due to the ongoing financial crisis went global and, combined with a large buildup in oil inventories (Mabro, 2009), led to significant oil price decreases, with Brent crude declining by about 70 percent by the spring of 2009 (six months after the peak in Brent crude prices).
- 2015-2016: The expansion of oil production and exports in the United States since the end of the Great Recession, and to a lesser extent in Russia, prompted OPEC to expand production in order to preserve market share, leading to a supply glut. Additionally, a global manufacturing recession in 2015, driven by a strong dollar and an economic slowdown in China, adversely impacted global demand conditions for oil. In response, Brent crude prices more than halved over an eight-month period and recovered only partially after this period.
In the chart below, we trace the fall in the price of Brent crude for each of these episodes, along with the decline experienced in the recent period:

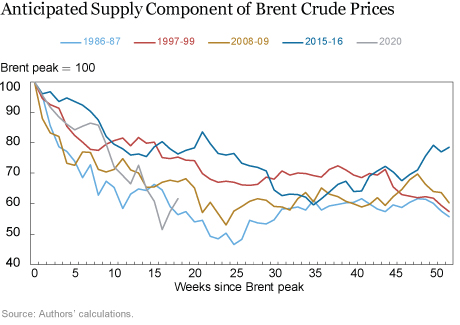
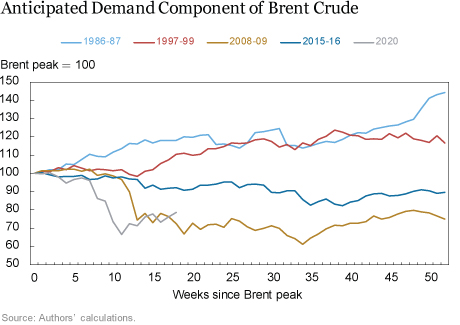
In order to gauge the importance of perceived demand and supply factors in driving these historical oil price selloffs, we apply the demand and supply oil price decomposition methodology from the New York Fed’s Oil Price Dynamics Report to these episodes. This decomposition employs the approach outlined in Groen, McNeil, and Middeldorp (2013) and Groen and Russo (2016), which uses a statistical model and a large number of financial market and high-frequency oil market variables (such as rig counts) to estimate factors from these variables that have the highest correlations with oil price changes. These estimated factors are then examined to determine how they reflect demand or supply dynamics. The two charts below depict the model-determined perceived supply and demand components of the Brent crude price movements from the first chart.


Analyzing the two charts above, it becomes clear that an increase in anticipated oil supply is the common ingredient of these selloffs. Conversely, the role of global demand expectations differs across these episodes. For example, in the 1985-86 and 1997-99 episodes, expansionary oil supply expectations dragged down prices while global demand expectations remained at worst constant and generally improved over the one-year period after the respective peaks in Brent crude prices. In the 2008-09 episode, however, the anticipated demand consequences of the Global Financial Crisis in itself led to a 30 percent plunge in Brent crude prices about three months after the peak in Brent crude oil prices. The fact that the 2008-09 selloff was driven by both demand and supply shocks resulted in persistently lower oil prices over the one-year period after the peak in those prices, whereas for the other selloff periods, which were supply-side driven, some of the price declines had been recouped by the end of this one-year window.
Putting the Current Oil Price Collapse in Context
When we compare recent oil price movements and their associated demand and supply components with those seen in prior selloff periods, it becomes clear that the developments of the past three months most closely resemble the pattern seen during the 2008-09 selloff. Both in the current environment and back in 2008-09 a combination of rapidly souring demand expectations and an ample perceived oil supply is what led to the collapse in oil prices. The difference this time is that the demand and supply outlook shocks occurred simultaneously, whereas in 2008-09 the oil price declines were initially set in motion by expanding oil supply expectations from higher OPEC production, followed by a deteriorating global demand outlook due to worsening global financial conditions. The shifts in investors’ expectations of global supply and demand did not reverse, resulting in persistently lower oil prices: a year after the initial peak in 2008, Brent crude prices were still about 60 percent lower.

Jan Groen is an officer in the Federal Reserve Bank of New York’s Research and Statistics Group.

Michael Nattinger is a research analyst in the Bank’s Research and Statistics Group.
How to cite this post:
Jan J.J. Groen and Michael Nattinger, “Putting the Current Oil Price Collapse into Historical Perspective,” Federal Reserve Bank of New York Liberty Street Economics , May 14, 2020, https://libertystreeteconomics.newyorkfed.org/2020/05/putting-the-current-oil-price-collapse-into-historical-perspective.html.
Disclaimer
The views expressed in this post are those of the authors and do not necessarily reflect the position of the Federal Reserve Bank of New York or the Federal Reserve System. Any errors or omissions are the responsibility of the authors.


 RSS Feed
 Follow Liberty Street Economics