A key objective of recent Federal Reserve policy actions is to address the deterioration in financial market functioning. The U.S. Treasury securities market, in particular, has been the subject of Fed and market participants’ concerns, and the venue for some of the Fed’s initiatives. In this post, we evaluate a basic metric of market functioning for Treasury securities— market liquidity—through the first month of the Fed’s extraordinary actions. Our particular focus is on how liquidity in March 2020 compares to that observed over the past fifteen years, a period that includes the 2007-09 financial crisis.
The COVID-19 Crisis and the Federal Reserve
The Federal Reserve responded aggressively to the COVID-19 pandemic, as described in this Liberty Street Economics post, slashing the federal funds rate, purchasing securities, and introducing myriad liquidity and credit facilities. Addressing market functioning has been central to many of these actions. On March 15, for example the Federal Open Market Committee announced purchases of Treasury securities and agency mortgage-backed securities (MBS) “to support the smooth functioning of markets” for those securities. Between March 15 and March 31, the Fed purchased $775 billion in Treasury securities and $291 billion in agency MBS.
Why Treasury Market Liquidity Matters
The U.S. Treasury securities market is the largest and most liquid government securities market in the world. Treasury securities are used to finance the U.S. government, to manage interest rate risk, as a risk-free benchmark for pricing other financial instruments, and by the Federal Reserve in implementing monetary policy. Having a liquid market—that is, one in which participants can quickly transact securities at low cost—is important for all of these purposes and is thus of great interest to market participants and policymakers alike.
The Market’s Structure
As described in this post, roughly half of Treasury securities trading occurs through interdealer brokers (IDBs), in which dealers and other professional traders transact with one another, and roughly half between dealers and clients. Our focus is on the IDB market, and on the electronic IDB market in particular, which accounts for about 87 percent of IDB trading. Our data source is BrokerTec, which is estimated to account for 80 percent of electronic IDB trading. As described here, all Treasury security trading through electronic IDBs is in the most recently auctioned (or on-the-run) coupon-bearing securities, which serve as benchmark securities for the Treasury market and interest rate markets more generally.
Evaluating Market Liquidity
To evaluate market liquidity, we reconstruct BrokerTec’s limit order book from the order messages submitted by platform participants. The history of the limit order book and history of trading activity enable us to construct various measures of market liquidity. The particular measures we examine are bid-ask spreads, depth, and price impact (as in this post and this paper), but we also look at trading volume and price volatility to get a fuller picture of market functioning.
We assess liquidity for the on-the-run five- and ten-year notes and thirty-year bond from January 3, 2005 to March 31, 2020. The on-the-run five- and ten-year notes are the two most traded Treasury securities, as shown in this post. The two-year note is the third most traded, but its tick size was halved in 2018, making it more difficult to assess its liquidity over time. Instead, we also examine the thirty-year bond, for which recent liquidity changes were especially striking, as shown below.
Liquidity Deteriorates Markedly in March 2020
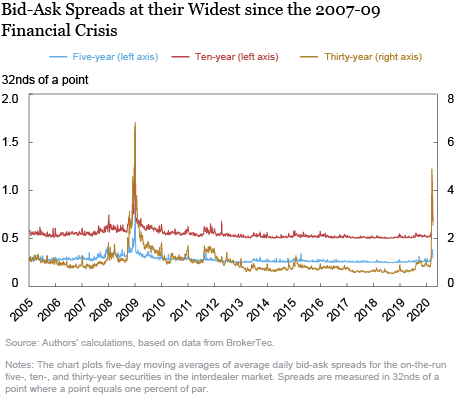
The bid-ask spread—the difference between the lowest ask price and the highest bid price for a security—is one of the most direct liquidity measures. As shown in the chart below, bid-ask spreads widened out sharply in March, peaking March 13 (ten-and thirty-year) and March 16 (five-year). Interestingly, the widening was more dramatic for the thirty-year bond, reaching levels over six times its post-crisis average, while only doubling for the ten-year note, and widening just 50 percent for the five-year note.
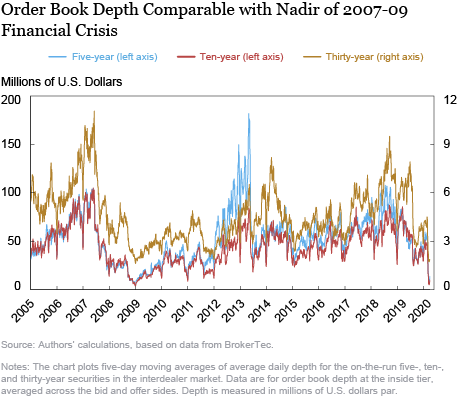
The next chart plots order book depth, measured as the average quantity of securities available for sale or purchase at the best bid and offer prices. Depth declined to levels comparable with the nadir of the 2007-09 financial crisis, reaching lows on March 12 (five-year), March 13 (ten-year), and March 17 (thirty-year). Interestingly, the depth decline was most notable for the shorter term securities, with five- and ten-year depth reaching levels as low as 10 percent of their post-crisis averages, but thirty-year depth reaching a low 38 percent of its post-crisis average.
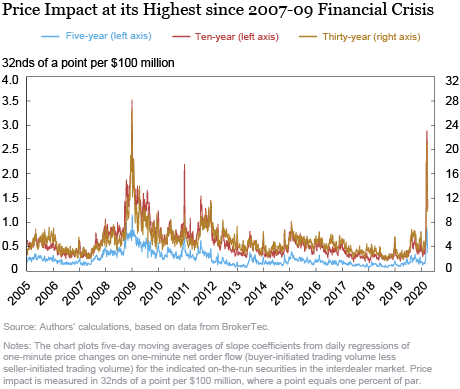
Measures of the price impact of trades also suggest a notable deterioration of liquidity. The next chart plots the estimated price impact per $100 million in net order flow (that is, buyer-initiated trading volume less seller-initiated trading volume). A larger price impact suggests reduced liquidity. In fact, price impacts reached their local peaks March 12 (five-year) and 13 (ten- and thirty-year) at levels roughly 5-6 times their post-crisis averages.
Price Volatility Jumps Higher
The COVID-19 pandemic resulted in a sizable increase in uncertainty about economic conditions, and the frequent arrival of news relevant to such conditions. This caused market expectations of asset values to shift rapidly, and hence price volatility to increase, as shown in the next chart. Bond volatility in particular reached its highest level in the past fifteen years for the five days ending March 19, and volatility on March 19 was the second highest for a single day over the same period (with March 18, 2009 the highest). Not surprisingly, volatility caused market makers to widen their bid-ask spreads and post less depth at any given price, and the price impact of trades to increase, illustrating the well-known relationship between volatility and liquidity.
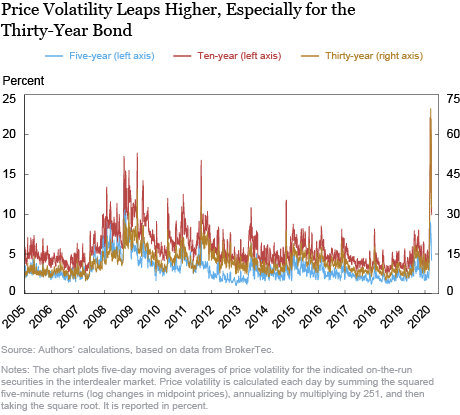
But not only does volatility lead to illiquidity, but illiquidity leads to volatility, which can result in liquidity spirals, as discussed in this paper. Indeed, market analysts point to the unwinding of relative value trades as a contributing factor to the high volatility in longer-term Treasuries (also see this analysis). The claim is that leveraged investors that bought Treasuries in the cash market and hedged the interest rate risk with futures contracts started unwinding these positions as futures prices rose, leading to a feedback loop of lower prices and greater sales in the cash market.
Trading Volume Soars
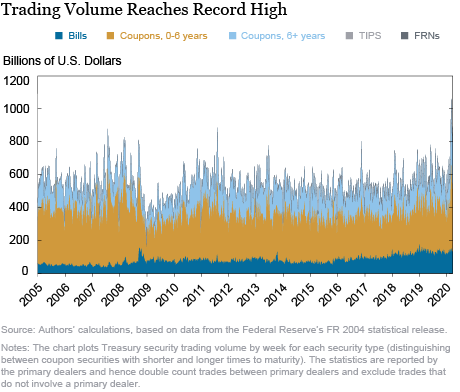
Despite the high volatility and illiquidity, on March 3 BrokerTec intermediated its highest level of Treasury security trading activity since the October 15, 2014 flash rally. Moreover, daily trading volume in the market overall reached a record high for the week ending March 4, averaging over $1 trillion, roughly twice its post-crisis average (see chart below). High trading volume amid high illiquidity is common in the Treasury market, and was also observed during the market turmoil around the near-failure of Long-Term Capital Management (see this paper) and during the 2007-09 financial crisis (see this paper). Periods of high uncertainty are associated with high volatility and illiquidity but also high trading demand.
Some Caveats
One caveat to our analysis is that the price sensitivity of Treasury securities to interest rates varies over time. While we’re only looking at on-the-run securities that have close to five-, ten-, or thirty-years to maturity, yields and coupon rates have trended down over time, causing durations and hence price sensitivities to increase. The duration of the on-the-run thirty-year bond was thus 18.4 years at the end of 2008 but 23.2 years at the end of our sample, implying a sensitivity that is about 25 percent higher now. A higher price sensitivity should result in a somewhat wider bid-ask spread, reduced order book depth, higher price impact, and higher price volatility, all else equal.
At the same time, there are reasons to think that our findings understate the extent of illiquidity in the Treasury market in March 2020. The preceding analysis pertains to the most liquid part of the market—the electronic IDB market for on-the-run notes and bonds. Press reports suggest that liquidity worsened especially in more aged, off-the-run securities, which trade through voice IDBs and in the dealer-to-client segment. Moreover, the most illiquid trading days in our sample prior to March occurred around holidays in late December 2008 when the market tends to be less liquid anyway, making the illiquidity in March 2020 all the more striking.
Evidence of Improvement?
While liquidity was unusually poor in March, the worst illiquidity occurred in the March 9-24 time frame, with notable improvements thereafter. In the electronic IDB market, the 30-year bond bid-ask spread averaged just over 1/32 of a point on February 28, over 5/32 March 11-13, but then just 2/32 on March 31. Moreover, press reports suggest a continuation of this positive liquidity trend into April. How Treasury market liquidity changes going forward, and what drives those changes, will be a continued focus of our analysis.

Michael Fleming is a vice president in the Federal Reserve Bank of New York’s Research and Statistics Group.
 Francisco Ruela is a senior research analyst in the Federal Reserve Bank of New York’s Research and Statistics Group.
How to cite this post:
Michael Fleming and Francisco Ruela, “Treasury Market Liquidity during the COVID-19 Crisis,” Federal Reserve Bank of New York Liberty Street Economics, April 17, 2020, https://libertystreeteconomics.newyorkfed.org/2020/04/treasury-market-liquidity-during-the-covid-19-crisis.html.
Disclaimer
The views expressed in this post are those of the authors and do not necessarily reflect the position of the Federal Reserve Bank of New York or the Federal Reserve System. Any errors or omissions are the responsibility of the authors.


 RSS Feed
 Follow Liberty Street Economics
There will be more days of Market Illiquidity and more severe than what we saw in March, not only in the Treasury and Bond Mkts but in other asset markets.