Over the past thirty years, more than 2,900 U.S. banks have transformed from pure depository institutions into conglomerates involved in a broad range of business activities. What type of banks choose to become conglomerate organizations? In this post, we document that, from 1986 to 2018, such institutions had, on average, a higher return on equity in the three years prior to their decision to expand, as well as a lower level of risk overall. However, this superior pre-expansion performance diminishes over time, and all but disappears by the end of the 1990s.
From Core Banks to Conglomerates
We usually think of “core” banks as depository institutions mainly dedicated to the extension of loans. Such core banks have represented, and still represent, the vast majority of banking institutions in this country, providing services to satisfy our everyday financial and business needs. However, since the late 1980s many core banks have transformed into conglomerate organizations that use the bank holding company vehicle to extend control and ownership to other types of legal entities. In many cases, this process has turned banks into increasingly complex organizations. These important industry trends have been discussed in previous posts, for example here, here, and here.
If the main purpose of banks is to provide liquidity services and extend credit—financial intermediation in its most traditional sense—then is a “migration” of banking institutions toward other activities undesirable? Or are those “other” activities just a reflection of financial intermediation evolving into a process that is less reliant on narrowly focused banks (see this post for a deeper discussion of these issues)? If the latter, then some forms of bank conglomeration may be socially desirable.
This migration from core banking to a conglomerate model has important ex post implications on performance and risk. Do banks that change their business scope increase their profitability and become more exposed to risk? Alternatively, are there diversification benefits from engaging in activities beyond just core banking? Establishing causality from banks’ choice of business model to their subsequent performance is hard because the expansion choice itself is clearly not random. Rather, it is plausible that banking firms with certain pre-existing characteristics are more or less likely to select the conglomerate model for themselves, and those same characteristics are also the factors driving future performance.
In this post, we focus on what happens before banks choose to become conglomerates. In particular, we ask whether banks departing from the core business model are drawn from a better or worse performance distribution than banks that do not expand into new businesses. Banks that outperform their peers may be in a better position to explore broader business horizons, and thus become conglomerates. Alternatively, banks that have underperformed in core banking activities may have stronger incentives to choose a different type of business strategy.
Both the quality of the banks that become conglomerates and their reasons for doing so have important policy consequences. If better quality institutions select to expand beyond core banking services, then their “migration” to a business model where other activities will compete for managerial and financial resources might imply a deterioration in both the quantity and the quality of core banking. However, if conglomeration reflects an adaptation to modern financial intermediation, then in fact these institutions might contribute to enhanced provision of liquidity and credit services. If, instead, the poorer performers become conglomerates, this could imply a need for stronger supervision of these entities and a worse financial stability outcome.
Which Banks Become Conglomerates?
Using a database described in a previous post, we focus on the population of bank holding company (BHC) organizations that operated between 1986 and 2018. We define “core banking firms” as BHCs that are made up exclusively of (one or more) chartered commercial banks. For example, First Western Bancorp, Inc. was, as of 1990, a Pennsylvania-based BHC with approximately half a billion dollars in assets. First Western Bancorp at the time controlled two commercial bank subsidiaries, and is therefore defined as a “core banking firm.” We define “conglomerate banking firms” as those BHCs that, in addition to commercial bank subsidiaries, also maintain control over entities with other primary business activities. Univest Corporation of Pennsylvania, another Pennsylvania-based BHC with approximately half a billion dollars in assets in 1990, is an example of an institution that meets the “conglomerate” definition, since it controlled one commercial bank subsidiary along with seven non-bank subsidiaries.
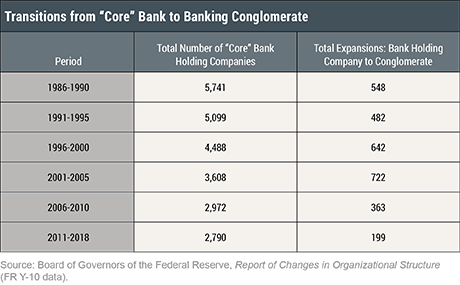
The following table illustrates the dynamics of the transition from core to conglomerate banking in the U.S. banking system. The columns show the total number of BHCs that in a given range of years operated as core banking firms and, of this number, those BHCs that decided to become conglomerates. The transition to conglomeration continued steadily through the first part of the 2000s, only to slow down in the years after the financial crisis.

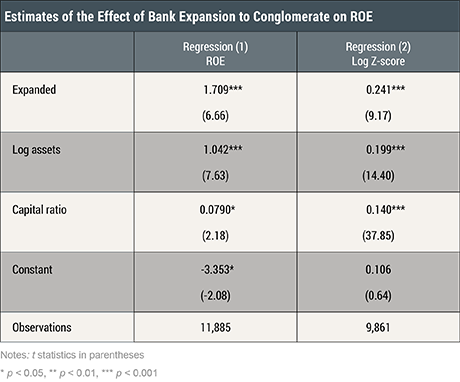
To evaluate the characteristics that underpin the decision to expand into businesses beyond core banking, we compare the return on equity (ROE) of expanding bank holding companies in the three years prior to their expansion to the ROE of non-expanding firms. The table below shows the results of a regression, based on data between 1986 and 2018. The dependent variable is the ROE of a bank in a given year. The variable “Expanded” is equal to 1 in the three years prior to the decision to become a conglomerate and equal to 0 otherwise. Hence, the estimated coefficient of “Expanded” indicates the difference in profitability during the three years prior to expansion between those two sets of banking firms.
The first column of the table shows that the coefficient on “Expanded” is positive. This means that on average, core banks that chose to turn into conglomerates between 1986 and 2018 exhibited higher ROE in the years prior to their decision than the non-expanding banks. This difference in performance remains robust after we account for other factors that determine ROE, such as size and capitalization (represented by the variables “Log assets” and “Capital ratio” in the table below).

Perhaps banks that choose to expand are only more profitable because they have greater risk exposures. A commonly employed metric of bank risk is the Z-score, defined as (ROA + C/A)/sd(ROA), where ROA is the bank’s return on their assets, C/A is its capital to asset ratio, and sd(ROA) is the standard deviation of ROA. Intuitively, the Z-score gauges the likelihood of default: Default is more likely (a lower Z-score) if a bank lacks the resources to face an adverse shock (small numerator) and/or is exposed to relatively large shocks (large denominator). The second column of the table above thus shows that, when the Z-scores of our sample are regressed on “Expanded,” the estimated coefficient is positive. In other words, banks that choose to pursue conglomeration were, all else equal, less risky in the years prior to the expansion decision.
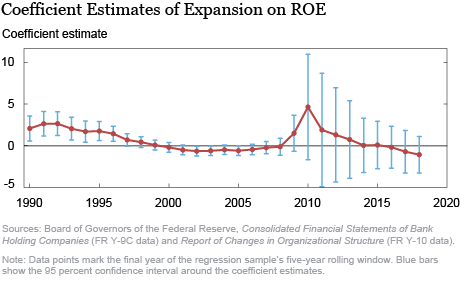
Many core banks have expanded over the years. Are “better” banks always the ones that transition to the conglomeration model? To capture the evolution in the types of banks that have pursued conglomeration over time, we estimated regressions on five-year “rolling windows” of data. The results, with ROE as the dependent variable, are presented in the chart below. Each point represents the estimated coefficient of “Expanded” from a rolling-window regression using observations from the previous five years. The regression estimates throughout the 1990s display a positive ROE differential between expanders and non-expanders. This effect is estimated precisely, as shown by the narrow vertical bars that display confidence intervals around the point estimate of the effect. However, the positive differential disappears over the subsequent decade. Not surprisingly, the coefficients for the rolling regressions that include the financial crisis years are estimated very imprecisely. Few firms became conglomerates during the financial crisis, and many of those that did were likely driven by crisis-specific factors, so we would avoid making a direct comparison with the pre-crisis years. The ROE differential remains close to zero and imprecisely estimated even in the more recent years.

Excluding the crisis years, what do we make of the pattern revealed in the data? Core banking firms that chose the conglomeration path in the late 1980s and a large part of the 1990s were those with better performance, but that difference is gone by the late 1990s. As pointed out in a previous post, the transformation of banks to conglomerates began in earnest toward the end of the 1980s when regulators considerably expanded the scope of permissible activities for bank holding companies. It is plausible that the expected costs of conglomeration were high in prior years, because banks were pursuing relatively new business strategies, entering into new activities, and facing new organizational challenges. Thus, earlier in the sample, the barriers to conglomeration might have been perceived as relatively high and only firms with relatively high returns to begin with would have made the conglomeration choice. As time passed and the conglomerate business model became more prevalent, these embedded costs decreased, thus potentially inducing more and more lower-performing banks to make the switch.
This initial analysis has focused on the ex ante problem of bank selection into a conglomerate model. Because we purposely refrain from analyzing the ex post consequences of the choice to expand—in terms of future profitability and risk—we cannot draw strong conclusions about the larger impacts of bank conglomeration. Nevertheless, this analysis does indicate that the expansion choice is not random and suggests that selection dynamics affect the desirability of the conglomerate model. This preliminary analysis has just scratched the surface of the complex factors behind banks’ decision to become more complex.
 Nicola Cetorelli is a vice president in the Federal Reserve Bank of New York’s Research and Statistics Group.
 Douglas Leonard is a senior research analyst in the Bank’s Research and Statistics Group.
How to cite this post:
Nicola Cetorelli and Douglas Leonard, “Selection in Banking,” Federal Reserve Bank of New York Liberty Street Economics, December 16, 2019, https://libertystreeteconomics.newyorkfed.org/2019/12/selection-in-banking.html.
Disclaimer
The views expressed in this post are those of the authors and do not necessarily reflect the position of the Federal Reserve Bank of New York or the Federal Reserve System. Any errors or omissions are the responsibility of the authors.


 RSS Feed
 Follow Liberty Street Economics