In the months leading up to the 2018 midterm elections, were economic expectations in congressional districts about to elect a Republican similar to those in districts about to elect a Democrat? How did economic expectations evolve in districts where the party holding the House seat would switch? After examining the persistence of polarization in expectations using voting patterns from the presidential election in our previous post, we explore here how divergence in expectations may have foreshadowed the results of the midterm elections. Using the Survey of Consumer Expectations, we show that economic expectations deteriorated between 2016 and 2018 in districts that switched from Republican to Democratic control compared to districts that remained Republican.
In all charts in this post, we split the survey respondents based on the party of the Representative elected in their congressional district. Specifically, we divide respondents into three groups: those represented by a Republican after both the 2016 and 2018 elections (henceforth “GOP‑GOP districts”), those represented by a Republican after the 2016 election and a Democrat after the 2018 election (“GOP-Dem districts”), and those represented by a Democrat after both the 2016 and 2018 elections (“Dem-Dem districts”). We do not have enough observations in the districts that flipped from Democratic to Republican control in 2018 to include these respondents as a separate group, and have dropped them from our analysis. We also exclude respondents from North Carolina’s 9th congressional district, where a new election will be held. In all charts, we indicate with vertical lines the timing of the 2016 election and the 2018 midterm election.
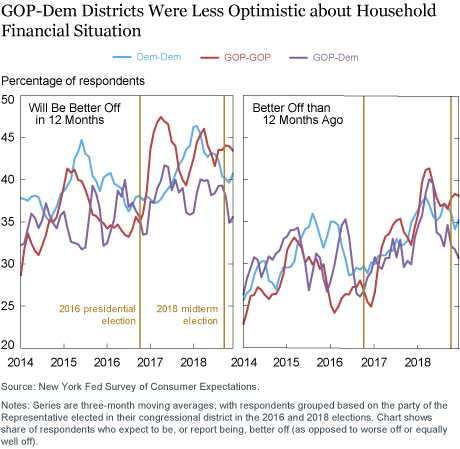
We begin by examining respondents’ assessments of their household financial situation. The left panel of the chart below shows the percentage of respondents who say they expect to be better off financially a year from now, while the right panel shows the percentage who report that they are better off financially now than a year ago. After the 2016 election, respondents who lived in GOP-GOP districts (shown in red) became dramatically more optimistic about their expected future personal financial situation. After some months, polarization between GOP-GOP and Dem-Dem districts (shown in blue) decreased, as pointed out in our previous post (where we split counties by 2016 presidential election outcomes). We also see an increase in optimism in GOP-Dem districts (in purple), but it is much smaller. While respondents in GOP-GOP districts and in GOP-Dem districts had the same level of forward-looking financial optimism in November 2016, a gap in their expectations had opened up by early 2017 and remained relatively wide through 2017 and 2018.

This pattern is consistent with respondents’ evaluation of their current financial situation relative to a year prior, shown in the right panel above, where a gap in expectations between GOP-GOP and GOP-Dem districts formed in early 2018. Notably, by the 2018 midterm elections, respondents in GOP-Dem districts were the least likely to believe they would be financially better off in a year and also the least likely to believe they were financially better off than one year before, even compared to respondents from Dem-Dem districts.
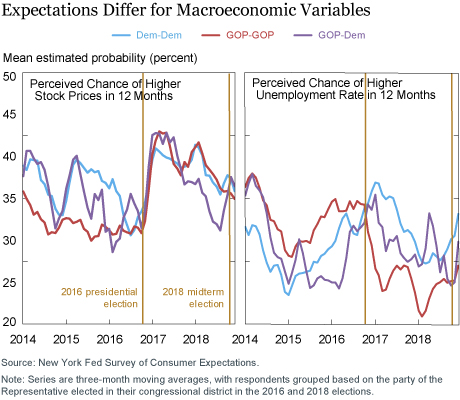
Next, we examine respondents’ expectations about the overall U.S. economy. The chart below shows the average perceived likelihood that U.S. stock prices (left panel) and unemployment (right panel) will be higher one year later. In the years before the 2016 election, GOP-GOP districts were consistently more pessimistic than Dem-Dem districts about the stock market, with GOP-Dem districts somewhat in between. Following a large increase in optimism in all three groups after the 2016 election, expectations about stock prices declined, nearly in parallel, for both GOP-GOP and Dem-Dem districts. Interestingly, though, stock market expectations decreased more in GOP-Dem districts than in the other two groups between summer 2017 and summer 2018. A small increase in optimism before the midterm elections returned the GOP-Dem districts to the same level as the other two groups.

We observed in our last post that expectations about unemployment were highly politically polarized. As shown in the right panel above, since mid-2017 expectations about unemployment have moved nearly in parallel in GOP-GOP and Dem-Dem districts, with respondents in GOP‑GOP districts consistently remaining a few percentage points more optimistic than respondents in Dem-Dem districts. Interestingly, the expectations of respondents in GOP-Dem districts fell mostly in between the GOP-GOP and Dem-Dem districts during this time period.
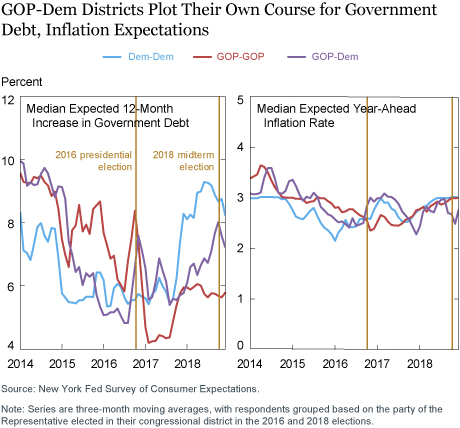
Finally, we look at trends in expectations about government debt and year-ahead inflation. The left panel of the chart below shows the median expected increase in government debt over the next year, and the right panel shows the median one-year-ahead expected inflation rate. We noted in our previous post that expectations about government debt, like those regarding unemployment, remained highly politically polarized throughout the past five years. Here, we observe that GOP-Dem districts resembled GOP-GOP districts around the 2016 election, anticipating large increases in debt just prior to the election and a rapid decline after the election. After the presidential inauguration, however, debt expectations in GOP-Dem districts started to track the expectations in the Dem‑Dem districts more closely. Since late 2017, when the debt expectations of Dem‑Dem districts began to increase, expectations in GOP-Dem districts have increased more slowly, remaining approximately halfway between the expectations of the GOP-GOP and Dem-Dem districts. These results suggest that economic expectations in “swing” districts may be in between those of consistently Democratic and Republican districts for measures that are particularly polarized.

Meanwhile, in the right panel of the chart, inflation expectations jumped in GOP-Dem and Dem-Dem districts in the aftermath of the 2016 presidential election, while they hardly changed in GOP-GOP districts. Since mid-2017, however, while expectations of year-ahead inflation have largely converged between GOP‑GOP and Dem-Dem districts, expectations in GOP-Dem districts have fluctuated more, and just prior to the midterms showed a decline not observed in other districts. It is possible that some of the changes in expectations in summer and fall 2018 stem from anticipation of the midterm election results. However, it seems unlikely that the anticipation of the midterm election results explains most of the gap in expectations between GOP-GOP and GOP-Dem districts that formed in early 2018.
In summary, our analysis reveals a clear difference in the evolution of economic expectations between GOP-Dem and GOP-GOP districts in the run-up to the 2018 midterm elections. From a relatively comparable level in 2016, expectations regarding one’s personal financial situation, aggregate unemployment, and public debt became considerably less optimistic in GOP-Dem districts by mid-2018. We had shown in a 2017 post that economic expectations appeared to be affected by the outcome of elections. Today’s post suggests that there might also be a reverse effect: individuals’ economic expectations might affect their voting behavior, and the evolution of economic expectations may thus be predictive of election results.
Disclaimer
The views expressed in this post are those of the authors and do not necessarily reflect the position of the Federal Reserve Bank of New York or the Federal Reserve System. Any errors or omissions are the responsibility of the authors.

Olivier Armantier is an assistant vice president in the Federal Reserve Bank of New York’s Research and Statistics Group.

Michael Neubauer is a senior research analyst in the Bank’s Research and Statistics Group.

Daphne Skandalis is an economist in the Bank’s Research and Statistics Group.

Wilbert van der Klaauw is a senior vice president in the Bank’s Research and Statistics Group.
How to cite this blog post:
Olivier Armantier, Michael Neubauer, Daphne Skandalis, and Wilbert van der Klaauw, “Did Changes in Economic Expectations Foreshadow Swings in the 2018 Elections?,” Federal Reserve Bank of New York Liberty Street Economics (blog), May 15, 2019, https://libertystreeteconomics.newyorkfed.org/2019/05/did-changes-in-economic-expectations-foreshadow-swings-in-the-2018-elections.html.


 RSS Feed
 Follow Liberty Street Economics