


Over the past year, U.S. trade policy with China has undergone enormous changes, but with surprisingly little effect on overall trade balances. In fact, the U.S.’s twelve-month trade deficit, while highly volatile due to import front-running early in the year, ended 2025 at $1.2 trillion, almost unchanged from 2024. At the same time, China’s trade surplus with the world actually increased from $1 trillion to $1.2 trillion. However, when looking at changes between individual countries, one sees large shifts in bilateral balances. In this post, we will focus on changing trade flows between the U.S., China, and southeast Asia.
What Has Happened with U.S.–China Trade?
The charts below plot several views of the trade balances between the U.S., China, and countries in the Association of Southeast Asian Nations (ASEAN). The top panel shows the U.S.’s reported trade deficit with China and China’s reported trade surplus with the U.S. Both measures broadly agree that the bilateral trade imbalance decreased. The middle panel shows a similar set of plots for the trade imbalances between the U.S. and ASEAN. Both agree that the U.S.’s trade deficit with ASEAN increased significantly. Among the countries within ASEAN, Vietnam was the single largest driver of the deficit increase. Finally, the bottom panel shows the bilateral balances vis-à-vis China and ASEAN. These data agree that there was a large increase in China’s surplus with ASEAN. Taken as a whole, these charts provide evidence that, last year, China’s trade with the U.S. increasingly rerouted—one way or another—through ASEAN.
Trade Patterns Between U.S., China, and ASEAN
U.S. Trade Deficit with China Shrinks
Billions of dollars
Billions of dollars
U.S. Trade Deficit with ASEAN Increases
Billions of dollars
Billions of dollars
China’s Trade Surplus with ASEAN Increases
Billions of dollars
Billions of dollars
Some of the Changes in U.S. Deficits Reflected Statistical Anomalies
Digging a bit deeper into changes in these bilateral trade flows, we see first that there are clear discrepancies in the data that the U.S. and foreign statistical agencies report about trade with each other. As discussed in 2021 and 2025, these discrepancies in part reflect underreporting of U.S. imports from China. The chart below illustrates this phenomenon. The solid red line shows the discrepancy between what the U.S. says it imports from China and what China says it exports to the U.S. The dashed red line shows the average of this discrepancy in the period before the first trade war in 2018, while the dotted line shows the average during 2021 to 2024. The “missing import” gap with China has ballooned since the first trade war, including an additional $25 billion last year alone. Notably, a similar, but smaller, discrepancy has emerged in U.S. trade with Vietnam (and ASEAN more broadly), but in the opposite direction, so that U.S. imports appear to be overstated.
The U.S.’s “Missing” Imports with China Have Increased
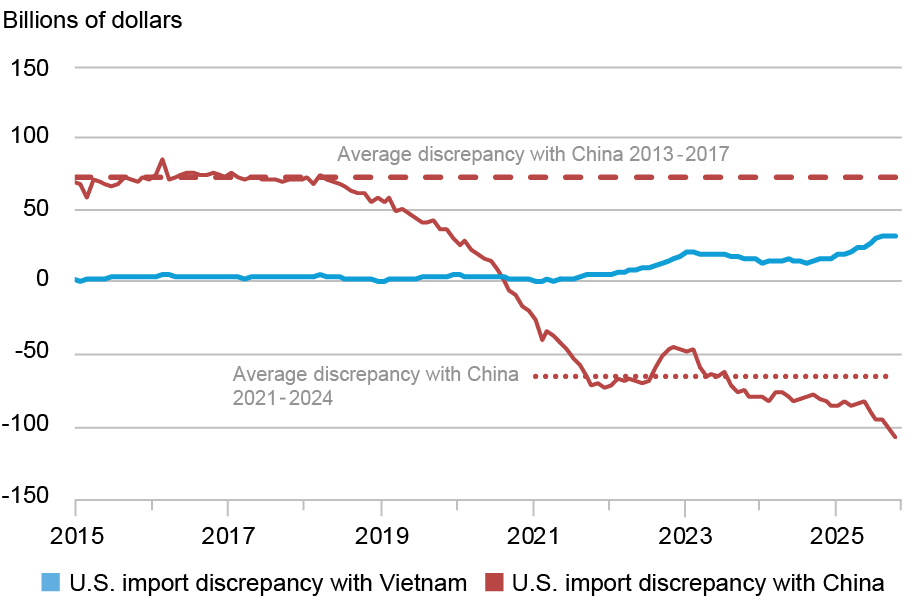
Note: The discrepancy is defined as the U.S.’s reported imports from the partner country minus the partner country’s reported exports to the U.S.
The direction of these discrepancies makes sense, as the realized effective tariff rate last year—calculated tariff duties divided by imports subject to duties—on U.S. imports from China is much higher than from ASEAN (34 percent versus 25 percent), and about half of ASEAN trade was not even dutiable. Against this backdrop, part of the change last year in the U.S.’s trade balances with China and ASEAN appears to have been “artificial” in the sense that U.S. import flows appear to have been distorted by tariff minimization strategies.
A Look into the Tech Sector…
However, there have clearly been major shifts in true trade flows, and those will be the focus of the rest of this post. The charts below dig deeper by showing the five largest changes in the U.S. trade balances with China and ASEAN at the Harmonized System Code (HS code) two-digit level. By far the largest are in HS codes 84 and 85, which are the categories for high-tech computer- and networking-related goods. For example, the U.S.’s deficit with China in HS 84 and 85 declined by about $70 billion, and increased by a rather similar amount, $80 billion, for ASEAN. China’s own balance with ASEAN shows a nearly $70 billion increase in its surplus in HS 85.
Changes in Trade Are Visible in Machinery and Electronics
Billions of dollars
Note: U.S. values show changes in deficit; China values show changes in surplus.
What are some examples of goods in these categories? We’ll start with consumer-facing products in HS 84, where laptops and tablets (HS 847130) illustrate the rerouting most vividly. These devices experienced very significant shifts in trade flows last year. Specifically, the U.S. trade deficit with ASEAN in laptops and tablets surged by $21 billion, accounting for half of the overall $43 billion increase in the deficit within HS 84. Conversely, the U.S. deficit with China in this subcategory has decreased by $24 billion out of a $29 billion total drop in HS 84. These changes are shown in the chart below.
The U.S. Deficit in Laptops Has Risen from ASEAN and Has Fallen from China
Billions of dollars
Note: The chart plots the U.S. deficit in Laptops and Tablets (HS 847130).
This pattern aligns with corporate strategies to diversify manufacturing amid U.S.-China trade tensions. For instance, Lenovo has shifted production outside of China, including to India and ASEAN. Similarly, Apple has expanded operations in Vietnam for iPad production, while Dell and HP began relocating portions of their notebook manufacturing to Southeast Asia as early as 2023. These changes point to a redirection of final assembly from China to ASEAN nations, reducing direct U.S. exposure to Chinese exports. Moreover, only about 1 percent of goods under HS 84 face an import tariff when coming from ASEAN, versus nearly 90 percent for China.
This rerouting doesn’t require a complete overhaul of supply chains, thanks to their inherent flexibility. Companies can relocate final assembly stages (like putting together laptops in Vietnam or Thailand) while continuing to source upstream components from established Chinese suppliers, preserving efficiency even as trade patterns shift to avoid direct U.S.-China exposure. Looking more closely at some of these upstream components, it becomes clear that Chinese inputs have found new inroads into ASEAN. These inputs, like processors, memories, displays, parts of transmission devices, and integrated circuits (HS 854231, 854232, 852491, 851779, 854239), make up $47 billion of the previously mentioned nearly $70 billion increase in China’s trade surplus with ASEAN in HS 85.
From Small Devices to Surging Data Centers
The sheer scale of these shifts, far exceeding what consumer products alone could absorb, points to larger structural forces. Specifically, the explosive buildout of digital infrastructure to support AI training, inference, cloud services, and data storage is driving massive demand for some of these components. Indeed, forecasts for investment in AI infrastructure and equipment vary widely, but some sources estimate that spending on computing hardware—including semiconductors and networking equipment— will reach roughly $550 billion in 2026 alone.
The flows into ASEAN are also supplying the components needed for digital infrastructure in the United States. The data centers powering technology companies’ AI needs rely heavily on servers, high-speed networking, and supporting electronics. One subcategory that stands out in our analyses is networking equipment, broadly defined as switching and routing apparatuses (HS 851762). Routers direct packets of data between different networks while switches handle the massive flow of information between servers within the same network. The U.S. import surge in this category reveals where the supply chain is actually shifting. Networking equipment has contributed $24 billion to the U.S.’s increasing deficit with ASEAN, representing nearly two-thirds of the $37 billion total rise in HS 85 deficits from the region. Meanwhile, the U.S.-China deficit in this category has continued to fall steadily, down by $2.2 billion this year. At the same time, China’s trade balance with ASEAN in networking equipment has flipped from a surplus to a deficit, showing a net inflow of just under half a billion dollars of such equipment into China. Although the net ASEAN-China flows in the category are small, we believe that it is a good example of how ASEAN is becoming more central in the supply chain of data center inputs.
Overall, the picture points to one in which trade policy uncertainty and geopolitical tensions are driving geographical diversification, with ASEAN both absorbing and rerouting flows that previously moved directly from China to the U.S.
Closing Thoughts
The shift in U.S. trade away from China is real, but the full picture is more complicated. Tariff-driven distortions obscure the headline numbers, and Chinese inputs continue to flow through ASEAN supply chains. Both consumer electronics and AI infrastructure are now driving U.S. imports from ASEAN, reflecting the expanding footprint of the region. Tariff tensions and the outlook on the AI industry will be critical drivers of supply chain reorientation in this region, and tracking trade flows will be essential to understanding how the various pressures shape the future geography of technology production.

Hunter L. Clark is an economic policy advisor in the Federal Reserve Bank of New York’s Research and Statistics Group.

Gregory Simitian is a research analyst in the Federal Reserve Bank of New York’s Research and Statistics Group.
How to cite this post:
Hunter L. Clark and Gregory Simitian, “In What Ways Has U.S. Trade with China Changed?,” Federal Reserve Bank of New York Liberty Street Economics, May 4, 2026, https://doi.org/10.59576/lse.20260504
BibTeX: View |


Disclaimer
The views expressed in this post are those of the author(s) and do not necessarily reflect the position of the Federal Reserve Bank of New York or the Federal Reserve System. Any errors or omissions are the responsibility of the author(s).
 RSS Feed
 Follow Liberty Street Economics
Auguste: The chart shows the change in values from 2024 to 2025.
Hi, Many thanks for this insightful piece. I wonder, what period is covered by the trade balances in between US and ASEAN on HS 84 and HS 85 ? Best regards.