


9 posts on "Hunter Clark"
May 11, 2026
Will Mounting Supply Chain Strains Hamstring the AI Investment Boom?
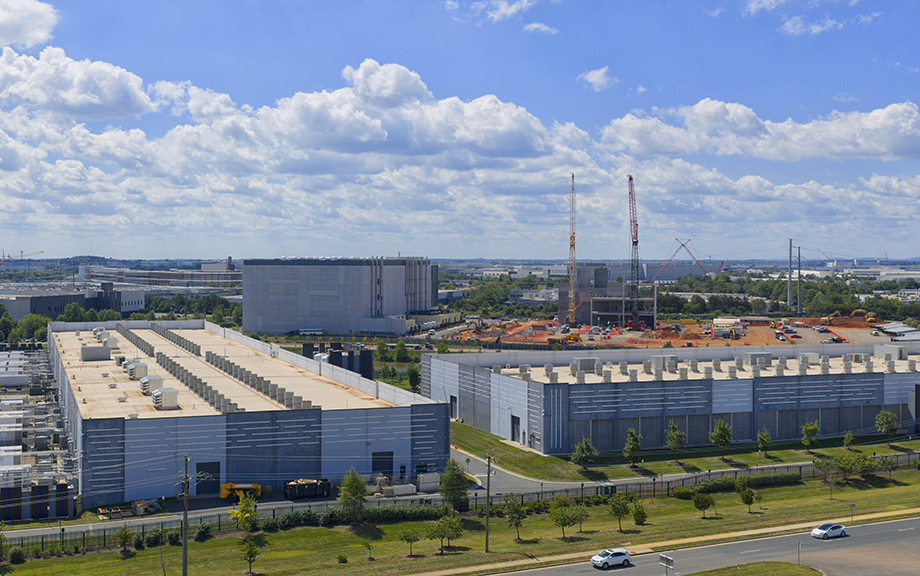
The conflict in the Middle East has precipitated a global supply shock—the third in six years following the pandemic in 2020 and Russia’s invasion of Ukraine in 2022. The current shock raises the specter of spillovers to the U.S. through both prices and physical shortages of goods. A critical conduit for spillovers through these channels is via Asian supply chains, especially from middle- to lower-middle income countries in southeast Asia, which are key suppliers for goods needed for the AI infrastructure build-out in the U.S. These countries are also heavily reliant on Middle East energy imports. This post examines key factors related to these Asian supply chain vulnerabilities.
Posted at 7:00 am in Artificial Intelligence (AI), International Economics, Supply Chain | Permalink
February 26, 2025
U.S. Imports from China Have Fallen by Less Than U.S. Data Indicate
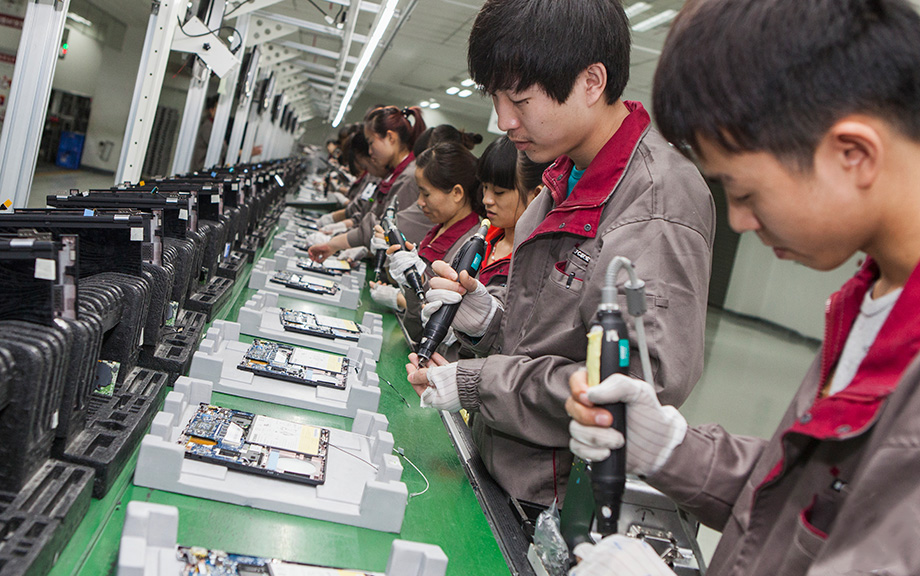
With new tariffs on China back in the headlines, this post seeks to offer some perspective on how much China’s exports have really been affected by multiple rounds of U.S. tariffs and export restrictions over the past seven years. The key takeaway is that U.S. imports from China have decreased by much less than has been reported in official U.S. statistics. As a result, the recent tariff increase on China could have a larger impact on the U.S. economy than is suggested by official U.S. data on the China import share, especially if favorable tariff treatment for direct-to-consumer imports is ended.
March 26, 2024
What Happens to U.S. Activity and Inflation if China’s Property Sector Leads to a Crisis?

A previous post explored the potential implications for U.S. growth and inflation of a manufacturing-led boom in China. This post considers spillovers to the U.S. from a downside scenario, one in which China’s ongoing property sector slump takes another leg down and precipitates an economic hard landing and financial crisis.
March 25, 2024
What if China Manufactures a Sugar High?

While the slump in China’s property sector has been steep, Chinese policymakers have responded to the falloff in property activity with policies designed to spur activity in the manufacturing sector. The apparent hope is that a pivot toward production-intensive growth can help lift the Chinese economy out of its current doldrums, which include weak household demand, high levels of debt, and demographic and political headwinds to growth. In a series of posts, we consider the implications of two alternative Chinese policy scenarios for the risks to the U.S. outlook for real activity and inflation over the next two years. Here, we consider the impact of a scenario in which a credit-fueled boom in manufacturing activity produces higher-than-expected economic growth in China. A key finding is that such a boom would put meaningful upward pressure on U.S. inflation.
February 22, 2023
How Much Can GSCPI Improvements Help Reduce Inflation?

Inflationary pressures—their determinants and evolution—continue to dominate policy discussions. In this post, we provide a simple framework to analyze the determinants of different measures of inflation and use it to lay out a risk-scenario analysis. We find that global supply factors captured by the New York Fed’s Global Supply Chain Pressure Index (GSCPI) are strongly associated with inflationary developments measured by the producer price index (PPI) and by the c0nsumer price index (CPI). Under the assumption that the GSCPI falls back to its historical average over twelve months, our model would project a substantial easing of consumer price inflation over 2023 to below 4.0 percent. The normalization of the GSCPI would then be consistent with a return of inflation to levels consistent with a soft-landing scenario.
January 6, 2023
Global Supply Chain Pressure Index: The China Factor

In a January 2022 post, we first presented the Global Supply Chain Pressure Index (GSCPI), a parsimonious global measure designed to capture supply chain disruptions using a range of indicators. In this post, we review GSCPI readings through December 2022, and then briefly discuss the drivers of recent moves in the index. While supply chain disruptions have significantly diminished over the course of 2022, the reversion of the index toward a normal historical range has paused over the past three months. Our analysis attributes the recent pause largely to the pandemic in China amid an easing of “Zero COVID” policies.
September 26, 2022
Is China Running Out of Policy Space to Navigate Future Economic Challenges?

After making progress slowing the pace of debt accumulation prior to the pandemic, China saw its debt levels surge in 2020 as the government responded to the severe economic slowdown with credit-led stimulus. With China currently in the midst of another sharp decline in economic activity due to its property slump and zero-COVID strategy, Chinese authorities have responded again by pushing out credit to soften the downturn despite already high levels of debt on corporate, household, and government balance sheets. In this post, we revisit China’s debt buildup and consider the growing constraints on Chinese policymakers’ tools to navigate future economic challenges.
June 2, 2022
Does China’s Zero Covid Strategy Mean Zero Economic Growth?

The Chinese government has followed a “zero covid strategy” (ZCS) ever since the world’s first COVID-19 lockdowns ended in China around late March and early April of 2020. While this strategy has been effective at maintaining low infection levels and robust manufacturing and export activity, its viability is being severely strained by the spread of increasingly infectious coronavirus variants. As a result, there now appears to be a fundamental incompatibility between the ZCS and the government’s economic growth objectives.
October 15, 2020
COVID‑19 Has Temporarily Supercharged China’s Export Machine

Hunter Clark takes a look at China’s export performance for 2020, which has been stronger than expected owing to an export structure well-positioned for the COVID-19 crisis.
 RSS Feed
 Follow Liberty Street Economics