The Federal Reserve Bank of New York’s Center for Microeconomic Data today released its Quarterly Report on Household Debt and Credit for the second quarter of 2016. It showed that overall household debt increased modestly over the period, with subdued mortgage originations and moderate but continued increases in non-housing related credit—particularly auto loans and credit cards. The total outstanding credit card balance now stands at $729 billion, up $17 billion from the first quarter, but still well below the peak of $866 billion reached in the fourth quarter of 2008. Credit card delinquency rates have continued to improve since peaking in 2008. We have previously “looked under the hood” of auto loans, and in this post, we present analysis that provides new insight into credit card debt by examining trends in credit card issuance and usage. The Quarterly Report and the following analyses are based on data from the New York Fed’s Consumer Credit Panel, which is a nationally representative sample drawn from Equifax credit reports.
Credit Card Usage Declines
The overall use of credit cards has fluctuated with the business cycle. Measured by the share of individuals with at least one card, participation peaked in the second quarter of 2008 at 68 percent of borrowers and then declined sharply to 59 percent during the Great Recession. Over that time period, banks reactively and proactively closed accounts, the Card Act of 2009 resulted in reduced lending to younger borrowers and changed certain practices (such as limiting solicitations, requiring clearer disclosures of terms, and restricting fees), and consumers deleveraged.
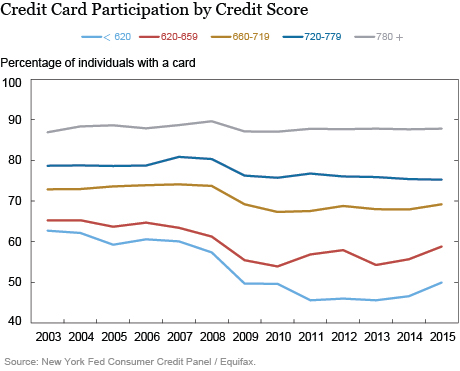
Since 2013, the participation rate has increased slightly and now stands at 61 percent. Declining use of credit cards owes primarily to subprime borrowers, whom we’ll categorize here as individuals with Equifax credit scores less than 620. About half of those borrowers with subprime scores have credit cards now, compared with more than 60 percent in 2007. Participation among the highest-scored borrowers has remained steady through the business cycle, at about 88 percent, as seen in the figure below.
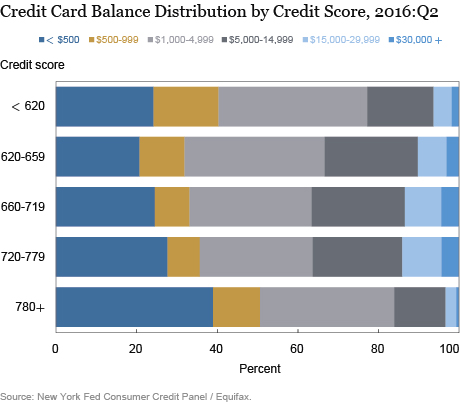
The chart below shows the current distribution of individual-level aggregate credit card balances across credit score groups. Although just over 40 percent of cardholders overall hold a balance of $1,000 or less, around 14 percent have balances greater than $10,000. When comparing the distribution of balances across credit score groups, we see some surprises. While an increase in a borrower’s credit score is initially accompanied by an upward shift in the debt balance distribution, borrowers with the highest credit scores instead are much more likely to hold smaller debt balances compared to all other groups. This pattern across credit score groups has been relatively stable over time. As households deleveraged following the financial crisis, we saw credit card balances fall for all borrowers, with the exception of balances associated with cardholders with a credit score of 780+, which have grown modestly.
With respect to total credit limits across all cards, as we would expect, lower-credit-score borrowers are extended significantly less credit than cardholders with higher scores. Subprime cards are associated with lower credit limits: almost half of subprime cardholders have total limits of less than $2,000. In the next highest group, which includes those with credit scores between 620-659, we see only 30 percent of borrowers with credit limits below $2,000. This share of subprime borrowers with relatively low credit card limits is approaching a new high in our post-1999 data series. On the other hand, 84 percent of borrowers with a score of 780+ have total limits greater than $10,000, a share that has been steadily increasing over the past fifteen years. (A caveat here: available credit is an input to credit scores, inducing some reverse causality in this discussion.)
Originations
What about new extensions of credit? Originations are comprised of two channels: originations of new cards and credit-limit extensions on new and existing cards. Our analysis yields some important insights.
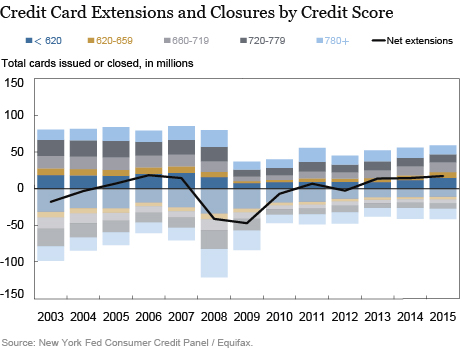
First, new card issuance, represented by the bars above the horizontal axis in the chart below, has been expanding since 2009, and especially so for those with lower credit scores. This group was more severely affected during the Great Recession; their access to new credit was severely restricted, as their accounts were closed both voluntarily and involuntarily. Nearly half of all card closures (represented by the bars below the horizontal axis) in 2010 and 2011 belonged to borrowers with credit scores of 660 and below, although they comprise only 33 percent of card borrowers. Reversing the sharp net decline in the number of credit cards during 2008-10 (as shown by the black line in the chart), in recent years, the level of new card issuance to this group has been strong and is now approaching pre-recession levels.
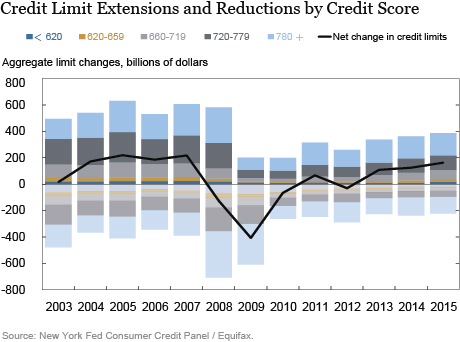
A similar analysis of changes in individual-level aggregate credit card limits brings us to the second key insight. Although new cards are disproportionately issued to lower credit score borrowers, the overall extension of new credit, measured by increases in aggregate credit limits, continues to go overwhelmingly to those with credit scores above 720. As the figure below shows, of the total credit extended to all borrowers, about 72 percent of it went to such individuals, which is down from the high 70s in the years immediately following the financial crisis. Lower score borrowers (defined as those with a score of 659 and below), have seen their share increase modestly over the past two years, commensurate with an increasing number of new cards.
Moreover, while less creditworthy borrowers are increasingly receiving new cards, the median limits on those new cards have increased, from $500 in 2009 to $1,000 in 2015. Over the same period, borrowers in the 720-779 and 780+ credit score groups have seen their median new card credit limits increase from $3,600 and $4,200 to $5,500 and $8,000 respectively.
Delinquencies and Charge-Offs
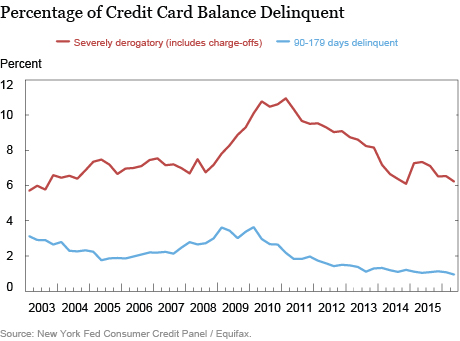
Though we publish a 90+ day delinquency rate in our Quarterly Report, many careful readers have noticed that this rate is notably higher than the 90+ day delinquency rate from other published estimates. This is because although banks are required to charge off balances at 180 days past due, the (stale) charged-off balances may remain on consumer credit reports for as long as lenders continue to attempt to collect. In the chart below, we show the 90+ delinquency rate (excluding defaulted loans) breaking out the severely derogatory balances, which are associated with charge-offs.
Overall, the credit-card delinquency rate has been trending down since the height of the financial crisis, and is nearing the low levels seen in 1999-2000. The downward trend is consistent with the movement in credit extensions toward borrowers with higher credit scores as well as an improvement in overall economic conditions. We see a similar downward trend in the share of severely derogatory balances—though at a noticeably slower and delayed pace—indicating that the credit scores of those borrowers continue to be negatively impacted long after the banks have charged off those balances and taken the loss on their own balance sheets.
All of these trends in credit cards must be viewed in light of technological change in consumer finance, particularly the rise of debit cards as a major means of payment. The recent developments in credit card extensions have common patterns with overall household debt, as the deleveraging period ended in 2013 and balances have begun increasing, if slowly. Lower-credit-score borrowers, once squeezed out of the market and paying down debt, are beginning to recover their ability to access credit with newly opened cards—although the borrowers with high credit scores are seeing the biggest expansions to their borrowing limits. Improving economic conditions and tighter lending have resulted in a sustained decline in delinquencies, as the credit card market continues to recover from the greatest credit crunch since the Great Depression.
Disclaimer
The views expressed in this post are those of the authors and do not necessarily reflect the position of the Federal Reserve Bank of New York or the Federal Reserve System. Any errors or omissions are the responsibility of the authors.

Graham Campbell is a graduate summer associate in the Federal Reserve Bank of New York’s Research and Statistics Group.

Andrew F. Haughwout is a senior vice president in the Bank’s Research and Statistics Group.

Donghoon Lee is an officer in the Bank’s Research and Statistics Group.

Joelle Scally is the administrator of the Center for Microeconomic Data in the Bank’s Research and Statistics Group.

Wilbert van der Klaauw is a senior vice president in the Bank’s Research and Statistics Group.
How to cite this blog post:
Graham Campbell, Andrew F. Haughwout, Donghoon Lee, Joelle Scally, and Wilbert van der Klauuw, “Just Released: Recent Developments in Consumer Credit Card Borrowing,” Federal Reserve Bank of New York Liberty Street Economics (blog), August 9, 2016, http://libertystreeteconomics.newyorkfed.org/2016/08/just-released-recent-developments-in-consumer-credit-card-borrowing.html.


 RSS Feed
 Follow Liberty Street Economics