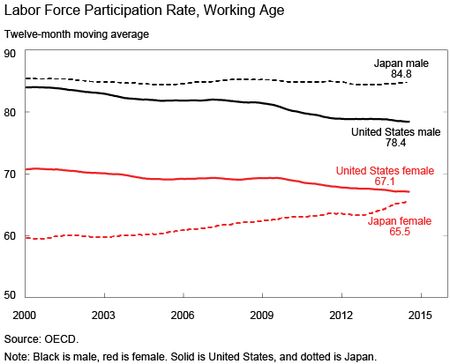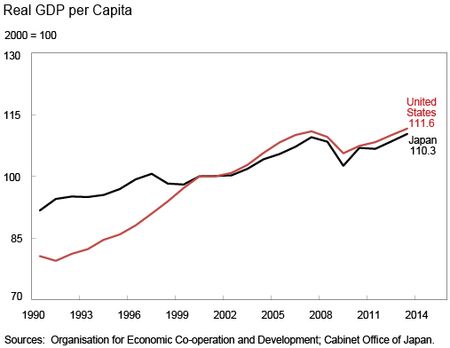
Japan’s population is shrinking and getting older, with the population falling at a 0.2 percent rate this year and the working-age population (ages 16 to 64) falling at a much faster rate of almost 1.5 percent. In contrast, the U.S. population is rising at a 0.7 percent annual rate and the working-age population is rising at a 0.2 percent rate. So far, supporting the growing share of Japan’s population that is 65 and over has been the substantial increase in the share of working-age women entering the labor force. In contrast, U.S. labor force participation rates have been falling for both men and women. Japan’s labor market adjustments help explain the steady, albeit, modest growth in output per person despite the surge in the 65 and over cohort. Indeed, Japan has been able to match U.S. per capita growth since 2000.
The United States and Japan are experiencing very different population trends. Organisation for Economic Co-operation and Development (OECD) data show that the U.S. population has increased 12 percent since 2000, while Japan’s population has fallen back to near where it was that year. The more striking development is that the working-age population in Japan is down 9 percent since 2000 while it is up 12 percent in the United States. As a consequence, the population share of those 65 and over has increased from 17 percent to 23 percent in Japan over this period while the U.S. share has increased from 12 percent to 14 percent.
The difference in their labor forces, however, is narrower. (The labor force includes those with a job and those actively looking for work.) That is, the labor force is not falling as much as the working-age population in Japan and is not rising as much as that cohort in the United States.
A breakdown of the labor force participation rate in the chart below (labor force divided by the corresponding population) for the working-age population shows very different trends in the two countries. In Japan, the working-age female labor participation rate has increased by 6 percentage points since 2000, with the size of the labor force increasing 2 percent even as the number of people in this cohort declined 9 percent. The corresponding female labor force participation rate fell in the United States, with the labor force rising 9 percent, which is slower than the 12 percent increase in the population of this cohort. The decline in U.S. male labor force participation was a bit greater, while the Japanese male participation rate has remained steady at a high level. Note that the large gap in the participation rate for women in the two countries that existed in 2000 has largely disappeared.
The increase in Japan’s female labor force participation and the decline in U.S. participation rates have moderated the economic impact of widely divergent demographic trends. While there is a 21 percentage point difference in changes in the working-age population since 2000 (+12 percent versus -9 percent), the difference in labor force growth is 12 percentage points (+9 percent versus -3 percent). The difference in employment growth shrinks even more to 9 percentage points (+6 percent versus -3 percent) as the U.S. unemployment rate is higher than it was in 2000 and Japan’s rate is lower.
The offsetting trends in labor force participation rates have helped minimized differences in per capita growth between the two countries since 2000. Over time, a country’s growth is dictated by the quantity and quality of its labor and capital, along with it success in improving how workers and capital are used (total factor productivity). The moderation of differences in the labor force given the wildly different demographic trends has contributed to a very small gap in per capita GDP growth since 2000 for the two countries, as seen in the chart below. The 1990s was a decade of weak growth in Japan relative to that in the United States, but Japanese GDP adjusted for population growth has closely tracked that of the United States since then even as the U.S. economy grew more than twice as fast (25 percent versus 10 percent).
The challenge for Japan is to sustain growth while the population continues to age. The United Nations (UN) estimates that the pace of the decline in Japan’s working-age population is easing, but will still fall at an average rate of 0.9 percent per year from 2015 to 2020. In particular, there are limits to how much higher the female labor force participation rate can rise after increasing to near the U.S. rate. This will be an unrelenting challenge for the Japanese economy as the 65 and over cohort is set to rise steadily and will only peak in 2055 when this group is projected to be 37 percent of the population.
The demographic trends are not nearly so dire in the United States, even with the aging of the baby-boom generation. The working age-population is still growing, with the UN projection of a 0.3 percent rate increase per year from 2015 to 2020. In addition, the aging is set to be much slower than in Japan, with the 65 and over cohort rising from 15 percent of the population to 22 percent by 2055, which will still be less than what it is in Japan today.
Disclaimer
The views expressed in this post are those of the authors and do not necessarily reflect the position of the Federal Reserve Bank of New York or the Federal Reserve System. Any errors or omissions are the responsibility of the authors.

Thomas Klitgaard is a vice president in the Federal Reserve Bank of New York’s Research and Statistics Group.
Preston Mui is a senior research analyst in the Bank’s Research and Statistics Group.


 RSS Feed
 Follow Liberty Street Economics
Thomas and Preston, Very interesting write up. I think the Real GDP per capita chart is quite amazing in the context of QQE in Japan. If only they could create working aged adults as easily as central bank reserves (female participation rate aside). Thanks for drawing attention to this important topic. Best, Dan