The coronavirus pandemic and the various measures to address it have led to unprecedented convulsions to the U.S. and global economies. In this post, I examine those extraordinary impacts through the lens of personal consumption expenditures on discretionary and nondiscretionary services, a framework I developed in a 2011 post (and subsequently employed in 2012, 2014, and 2017). In particular, I show that there were exceptional declines in both services categories during the spring; their recoveries, however, have displayed notably different patterns in recent months, with nondiscretionary services expenditures nearly back to their prior level and discretionary services expenditures seemingly stalled well below their pre-pandemic peak.
A Historical Perspective on the Pandemic Plunge
In this post, I use the monthly data on personal consumption expenditures compiled by the Bureau of Economic Analysis rather than the quarterly frequency used in the previously cited posts. This higher frequency is necessary because of the rapid shifts in spending that occurred during the initial spread of the pandemic. Even though the monthly data are noisier than the quarterly data, the general patterns seen in the quarterly data are maintained in the monthly data. At the same time, while the monthly data cannot capture turning points in pandemic-era consumption behavior as precisely as very high frequency data, the monthly data have the advantage of a wider scope.
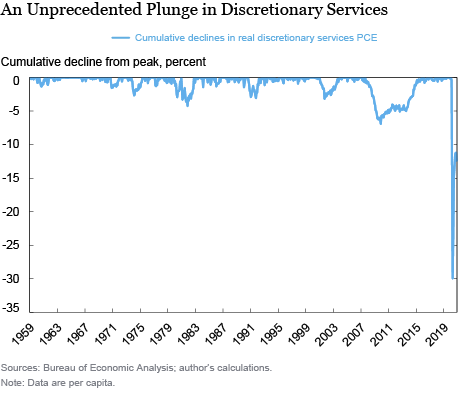
To provide a perspective on the fall in expenditures in the COVID-19 recession, I update a chart from the previous posts on this subject that displays how much discretionary services expenditures fell from their previous peak in real per capita terms (to account both for inflation and population growth over time)—a zero value in this chart means that these expenditures were above their previous peak. As seen below, discretionary services expenditures fell about 30 percent in this recession, dwarfing even the decline recorded in the Great Recession. In addition, even with a sizable rebound since April, discretionary services expenditures remained more than 12 percent below their peak as of November, a gap that still greatly exceeds the decline in the Great Recession.
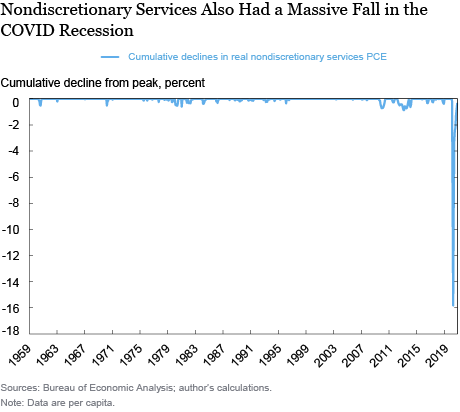
For nondiscretionary services expenditures, the pattern is, if anything, more extreme than anything seen in past cycles. The nearly 16 percent decline in these expenditures between February and April makes the falls seen in previous recessions seem almost imperceptible, as reflected in the chart below. The subsequent rebound has also been more complete, with nondiscretionary services expenditures less than 0.5 percent below their February level as of November, roughly similar to the largest declines seen during the early 2010s. This pattern importantly reflects the behavior of health care expenditures during the pandemic, a subject I return to in the next section.
The Recovery since April
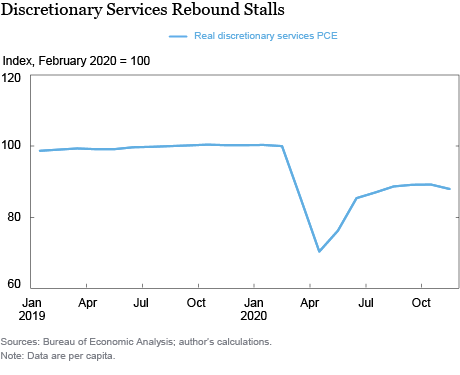
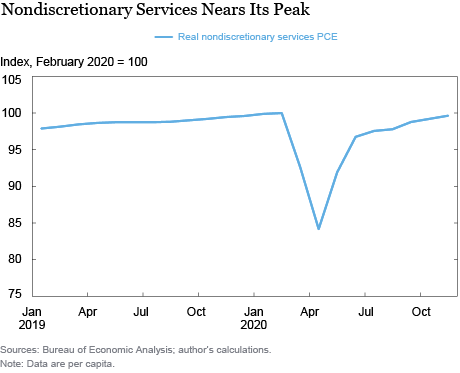
I now take a closer look at the recovery of discretionary and nondiscretionary services expenditures since their trough in April. To do so, I use the same data as before, but present the information differently. First, I zoom in on the 2019-20 period to show the recent patterns of these expenditures more clearly. Second, with the shorter period and less concern about the impact of the longer-term uptrend, I show expenditures relative to their level in February 2020, when the peak in overall economic activity occurred.
While the basic outlines of the recent patterns of these expenditures are still evident—the rapid decline in both categories in March and April, the initial rapid recovery during reopening, and the less complete recovery in discretionary services—other aspects of the situation become clearer in the two charts below. Of particular note is the slower pace of recovery since June, a deceleration that has occurred in both categories. For discretionary services expenditures, this slowdown became more of a stall during the fall, reflecting the impact of the widespread surge of the pandemic at that time. Because discretionary expenditures were still well below their pre-pandemic levels, that shortfall could persist for some time. In contrast, the recovery in nondiscretionary services expenditures continued through the fall, albeit at a slower pace. As a result, nondiscretionary expenditures were close to their February level as of November.
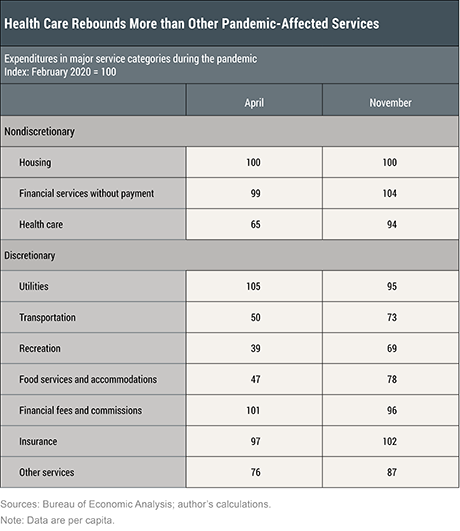
To provide some additional context for these patterns, the table below shows expenditures in April (the trough for consumption) and November (the latest data) relative to the February 2020 level for major categories of nondiscretionary and discretionary services. This table shows the differential impact of the pandemic across these expenditure categories as well as how it scrambled for a time the distinctions between discretionary and nondiscretionary expenditures.
For nondiscretionary services, the clear driver behind its extraordinary behavior is health care services spending. In an irony of this crisis, many types of health expenditures were deemed discretionary, or some health offices were judged to be nonessential, leading to a decline of more than 35 percent between February and April in these expenditures. Since April, befitting its less discretionary nature, this category has had a significant rebound, experiencing a more complete recovery than many of the pandemic-impacted discretionary services categories.
In discretionary services, the most significant drops occurred in categories that have been frequently reported upon during this crisis: transportation, recreation, food services and accommodations, and other services (which includes items like education, personal care, household maintenance, and net foreign travel). In the first three categories, expenditures fell more than 50 percent between February and April. In an indication of the slower rebound in discretionary expenditures, in November none of these four categories was close to 90 percent of their February level.
Final Thoughts
This post fits with the narrative that many discretionary services sectors are still suffering because of either government restrictions or private actions to guard against COVID-19, even as the overall economy has rebounded considerably. With the recent surge in the pandemic, discretionary services have again been adversely impacted. At the same time, positive developments on the vaccine front suggest more light at the end of the tunnel. New York Fed Research staff will continue to monitor these data, as well as higher-frequency alternative data, to assess the impact of pandemic-related developments on consumer spending.

Jonathan McCarthy is a vice president in the Federal Reserve Bank of New York’s Research and Statistics Group.
How to cite this post:
Jonathan McCarthy, “Discretionary and Nondiscretionary Services Expenditures during the COVID-19 Recession,” Federal Reserve Bank of New York Liberty Street Economics, January 15, 2021, https://libertystreeteconomics.newyorkfed.org/2021/01/discretionary-and-nondiscretionary-services-expenditures-during-the-covid-19-recession.html.
Disclaimer
The views expressed in this post are those of the author and do not necessarily reflect the position of the Federal Reserve Bank of New York or the Federal Reserve System. Any errors or omissions are the responsibility of the author.


 RSS Feed
 Follow Liberty Street Economics