Thomas Klitgaard and Preston Mui
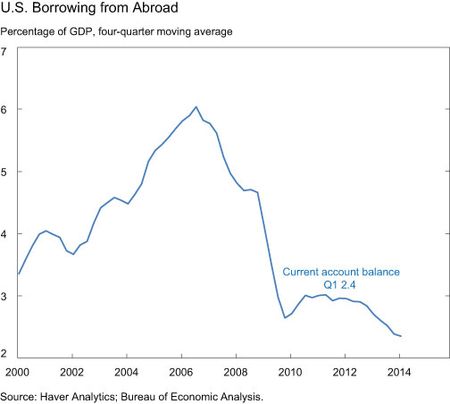
The United States has been borrowing from the rest of the world since the mid-1980s. From 2000 to 2008, this borrowing averaged over $600 billion per year, which translates into U.S. spending exceeding income by almost 5.0 percent of GDP. Borrowing fell during the recent recession, as would be expected, and then rebounded with the recovery. Since 2011, however, borrowing has trended down and fell to 2.4 percent of GDP in 2013, the smallest amount as a share of GDP since 1997. A reduced dependency on foreign funds can be viewed as a favorable development to the extent that it reflects an improvement in the fiscal balance to a more easily sustainable level. However, it also reflects the lackluster recovery in residential investment, which is one reason the economy has yet to get back to its full operating potential.
The amount borrowed from the rest of the world is measured by the current account balance, which is the broadest measure of cross-border transactions. As seen in the chart below, the United States was spending substantially above its income before the recession, to the tune of 5.8 percent of GDP in 2006. The amount of borrowing fell during the recession and started to rebound in 2010, but borrowing has since trended down.
A nation’s foreign borrowing is the difference between domestic saving and investment spending. Consider simplified national accounting identities with income allocated to consumption or saving and spending allocated to consumption or investment. Dropping out consumption from both identities shows that the difference between spending and income is the same as the difference between saving and investment spending, with the gap determining whether a country is lending to or borrowing from the rest of the world. That is, a country borrows from the rest of the world when it does not save enough to finance its own investment spending. From this perspective, the United States is borrowing less because the difference between saving and investment spending is shrinking.
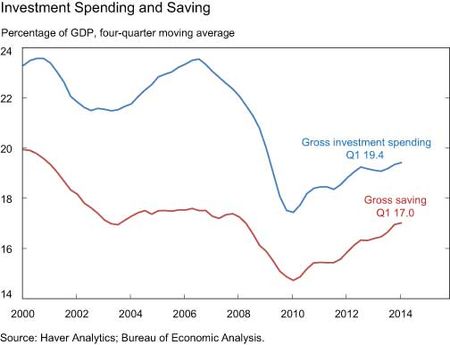
Saving is not easy to measure. One approach is to use the current account balance and GDP data on investment spending to back out a measure of domestic saving. As seen in the next chart, U.S. borrowing declined during the recession because investment spending fell more than saving. Both saving and investment spending then recovered, with the level of external borrowing rising from 2.6 percent of GDP in 2009 to 3.0 percent in 2010. Since then, however, saving has been rising faster than investment spending.
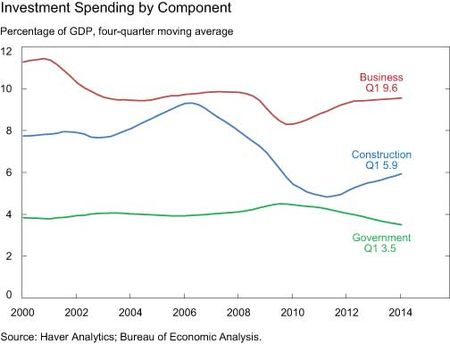
Breaking out gross investment spending into its major components in the chart below shows that overall spending is being held back relative to pre-recession levels by construction spending, with almost all the shortfall due to residential construction. Other private investment spending on equipment and software is back to pre-recession levels as a share of GDP. Government investment spending is also a contributing factor, although the gap with pre-recession levels is not large as a share of GDP.
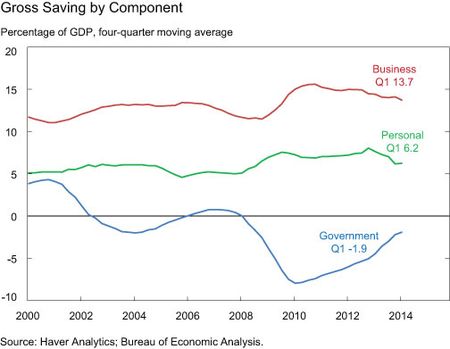
GDP data include a measure of saving that breaks down gross saving into personal, business, and government components. As seen in the next chart, the business component, which consists largely of undistributed profits and depreciation, is roughly twice as large as personal saving. Both rose as a share of GDP in 2009-10 and remain above pre-recession levels, even after trending down recently.
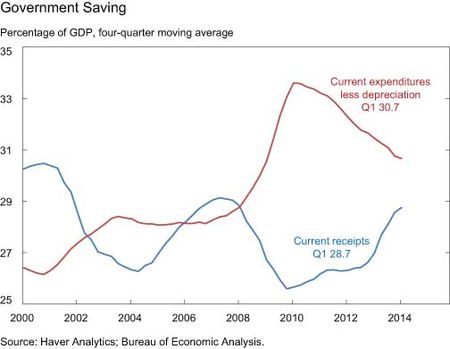
The recent upswing in total gross saving is driven by the volatile government component, which is defined as current receipts less current expenditures minus depreciation. The chart below shows that the gap between revenue and adjusted expenditures widened dramatically from 2007 to 2010. Expenditures in dollar terms continued to grow during the recession at near the pace set in previous years, but the drop in GDP caused expenditures to rise as a share of GDP. The dollar growth in expenditures then slowed in 2010 and eased to very modest rates in 2011 through 2013, so that the recovery in GDP caused expenditures as a share of GDP to fall. The large drop in receipts as a share of GDP during the recession is due in part to the payroll tax cut; the end of the tax cut at the beginning of 2013 brought current receipts as a share of GDP closer to pre-recession levels.
Improvements in government saving can reduce private saving, particularly in the case last year when the tax-rate hike left less income to be saved. Personal saving did indeed fall last year, but its decline, equal to 1.5 percent of GDP, was not enough to offset the 2.6 percent of GDP increase in government saving.
It needs to be noted that the GDP measure of saving in 2013 is higher than the measure derived from current account and investment spending data seen in the second chart of this post. The difference is substantial, with the GDP measure having U.S. borrowing falling to 1.3 percent of GDP last year instead of 2.4 percent. Revisions will hopefully reduce this disagreement and clarify the extent and the causes of the drop in U.S. borrowing.
Disclaimer
The views expressed in this post are those of the authors and do not necessarily reflect the position of the Federal Reserve Bank of New York or the Federal Reserve System. Any errors or omissions are the responsibility of the authors.

Thomas Klitgaard is a vice president in the Federal Reserve Bank of New York’s Research and Statistics Group.

Preston Mui is a senior research analyst in the Bank’s Research and Statistics Group.


 RSS Feed
 Follow Liberty Street Economics