


178 posts on "Banks"
December 22, 2025
A New Public Data Source: Call Reports from 1959 to 2025

Call Reports are regulatory filings in which commercial banks report their assets, liabilities, income, and other information. They are one of the most-used data sources in banking and finance. In this post, we describe a new dataset made available on the Federal Reserve Bank of New York’s website that contains time-consistent balance sheets and income statements for commercial banks in the United States from 1959 to 2025.
December 17, 2025
Letters of Recommendation in the PhD Job Market: Lessons from Specialized Banks

Banks must extract useful signals of a potential borrower’s quality from a large set of possibly informative characteristics when making lending decisions. A model that speaks to how banks specialize in lending to an industry in order to better extract signals from data can potentially be applied to a number of real-world scenarios. In this post, we apply lessons from such a model to a topic of timely relevance in economics: job market recommendation letters. Institutions looking to hire new economists must evaluate PhD applicants based on limited and often noisy signals of future performance, including letters of recommendation from these applicants’ advisors or co-authors. Using insights from our model, we argue that the value of these letters depends on who reads them.
December 15, 2025
Designing Bank Regulation with Accounting Discretion

Why does the banking industry remain prone to large and costly disruptions despite being so heavily regulated? Is there a need for more regulation, less regulation, or simply different regulation? Our recent Staff Report combines insights from academic research in economics, finance, and accounting to provide a deeper understanding of the challenges involved in designing and implementing bank regulation, as well as opportunities for future exploration. This post focuses on the regulation of bank capital, but the ideas are applicable more broadly.
November 18, 2025
U.S. Banks Have Developed a Significant Nonbank Footprint

In light of the rapid growth of nonbank financial institutions (NBFIs), many have argued that bank-led financial intermediation is on the decline, based on the traditional notion that banks operate to take in deposits and make loans. However, we argue that deposit-taking and loan-making have not accurately characterized U.S. banking operations in recent decades. Instead, as we propose in this post, absent regulatory restrictions, banks naturally expand their boundaries to include NBFI subsidiaries. A significant component of the growth of NBFIs has in fact taken place inside the boundaries of banking firms.
November 4, 2025
Banking System Vulnerability: 2025 Update

As in previous years, we provide in this post an update on the vulnerability of the U.S. banking system based on four analytical models that capture different aspects of this vulnerability. We use data through 2025:Q2 for our analysis, and also discuss how the vulnerability measures have changed since our last update one year ago.
Posted at 7:00 am in Bank Capital, Banks, Financial Institutions, Liquidity, Systemic Risk | Permalink
October 16, 2025
The Shadow Value of Central Bank Lending

After the Great Financial Crisis, the European Central Bank (ECB) extended its monetary policy toolbox to include the use of long-term loans to banks at interest rates close to zero or even negative. These central bank interventions were aimed at supporting the transmission of expansionary monetary policy and likely played a crucial role in bolstering the financial stability of the euro area, namely by reducing the chance of bank runs. However, quantitative evidence on the effects of these interventions on financial stability remains scant. In this post, we quantify the effectiveness of central bank lending programs in supporting financial stability through the lens of a novel structural model discussed in this paper.
October 1, 2025
A Historical Perspective on Stablecoins
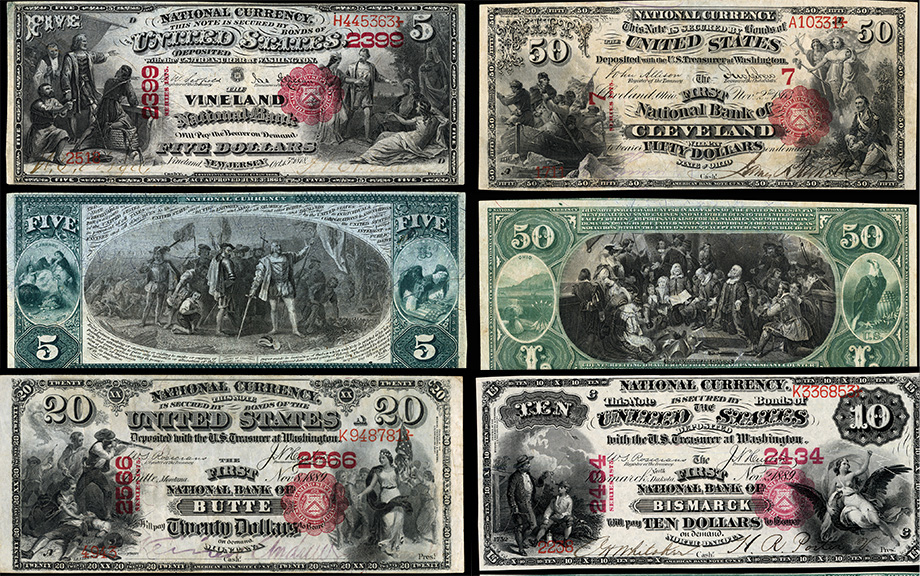
Digital currencies have grown rapidly in recent years. In July 2025, Congress passed the “Guiding and Establishing National Innovation for U.S. Stablecoins Act” (GENIUS) Act, establishing the first comprehensive federal framework governing the issuance of stablecoins. In this post, we place stablecoins in a historical perspective by comparing them to national bank notes, a form of privately issued money that circulated in the United States from 1863 through 1935.
September 30, 2025
Calming the Panic: Investor Risk Perceptions and the Fed’s Emergency Lending During the 2023 Bank Run

In a companion post, we showed that during the bank run of spring 2023 investors were seemingly not concerned about bank risk broadly but rather became sensitized to the risk of only about a third of all publicly traded banks. In this post, we investigate how the Federal Reserve’s liquidity support affected investor risk perceptions during the run. We find that the announcement of the Fed’s novel Bank Term Funding Program (BTFP), and subsequent borrowings from the program, substantially reduced investor risk perceptions. However, borrowings from the Fed’s traditional discount window (DW) had no such effect.
Reading the Panic: How Investors Perceived Bank Risk During the 2023 Bank Run

The bank run that started in March 2023 in the U.S. occurred at an unusually rapid pace, suggesting that depositors were surprised by these events. Given that public data revealed bank vulnerabilities as early as 2022:Q1, were other market participants also surprised? In this post, based on a recent paper, we develop a new, high-frequency measure of bank balance sheet risk to examine how stock market investors’ risk sensitivity evolved around the run. We find that stock market investors only became attentive to bank risk after the run and only to the risk of a limited number (less than one-third) of publicly traded banks. Surprisingly, investors seem to have mostly focused on media exposure and not fundamentals when evaluating bank risk. In a companion post, we examine how the Federal Reserve’s liquidity support affected investor risk perceptions.
August 7, 2025
Flood Risk and Flood Insurance

Recent natural disasters have renewed concerns about insurance markets for natural disaster relief. In January 2025, wildfires wreaked havoc in residential areas outside of Los Angeles. Direct damage estimates for the Los Angeles wildfires range from $76 billion to $131 billion, with only up to $45 billion of insured losses (Li and Yu, 2025). In this post, we examine the state of another disaster insurance market: the flood insurance market. We review features of flood insurance mandates, flood insurance take-up, and connect this to work in a related Staff Report that explores how mortgage lenders manage their exposure to flood risk. Mortgages are a transmission channel for monetary policy and also an important financial product for both banks and nonbank lenders that actively participate in the mortgage market.
 RSS Feed
 Follow Liberty Street Economics