


222 posts on "Household Finance"
April 6, 2020
Coronavirus Outbreak Sends Consumer Expectations Plummeting
The March Survey of Consumer Expectations, which was fielded between March 2 and 31, records a substantial deterioration in financial and economic expectations, including sharp declines in household income and spending growth expectations.
February 26, 2020
Did Subprime Borrowers Drive the Housing Boom?

The role of subprime mortgage lending in the U.S. housing boom of the 2000s is hotly debated in academic literature. One prevailing narrative ascribes the unprecedented home price growth during the mid-2000s to an expansion in mortgage lending to subprime borrowers. This post, based on our recent working paper, “Villains or Scapegoats? The Role of Subprime Borrowers in Driving the U.S. Housing Boom,” presents evidence that is inconsistent with conventional wisdom. In particular, we show that the housing boom and the subprime boom occurred in different places.
Posted at 7:00 am in Banks, Credit, Crisis, Household Finance, Housing, Recession | Permalink | Comments (8)
February 11, 2020
Charging into Adulthood: Credit Cards and Young Consumers

The New York Fed’s Center for Microeconomic Data today released the Quarterly Report on Household Debt and Credit for the fourth quarter of 2019. Total household debt balances grew by $193 billion in the fourth quarter, marking a $601 billion increase in household debt balances in 2019, the largest annual gain since 2007. The main driver was a $433 billion annual upswing in mortgage balances, also the largest since 2007.
December 13, 2019
Tariffs, Auto Loans, Rising College Costs, and Other Top LSE Posts of 2019
At year end, we look back at the top five most-read Liberty Street Economics posts of 2019.
November 13, 2019
Just Released: Racial Disparities in Student Loan Outcomes

A $20 billion rise in student loan balances in the third quarter of this year contributed to a $92 billion increase in total household debt, according to the latest Quarterly Report on Household Debt and Credit from the New York Fed’s Center for Microeconomic Data. This post explores racial disparities in student loan outcomes using information about the borrowers’ locations, grouping zip codes based upon which racial group constitutes the majority of an area’s residents.
October 10, 2019
Is Free College the Solution to Student Debt Woes? Studying the Heterogeneous Impacts of Merit Aid Programs
The rising cost of a college education has become an important topic of discussion among both policymakers and practitioners. At least eleven states have recently introduced programs to make public two-year education tuition free, including New York, which is rolling out its Excelsior Scholarship to provide tuition-free four-year college education to low-income students across the SUNY and CUNY systems. Prior to these new initiatives, many states, including New York, had already instituted merit scholarship programs that subsidize the cost of college conditional on academic performance and in-state attendance. Given the rising cost of college and the increased prevalence of tuition-subsidy programs, it’s important for us to understand the effects of such programs on students, and whether these effects vary by income and race. While a rich body of work has studied the effects of merit scholarship programs on educational attainment, the same is not true for the effects on financial outcomes of students, such as debt and repayment. This blog post reports preliminary findings from ongoing work, which is one of the first research initiatives to understand such effects.
October 9, 2019
Who Borrows for College—and Who Repays?
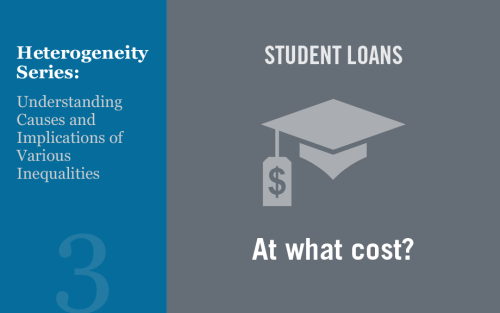
Student loans are increasingly a focus of discourse among politicians, policymakers, and the news media, resulting in a range of new ideas to address the swelling aggregate debt. Evaluating student loan policy proposals requires understanding the challenges faced by student borrowers. In this post, we explore the substantial variation in the experiences of borrowers and consider the distributional effects of various policy options.
October 7, 2019
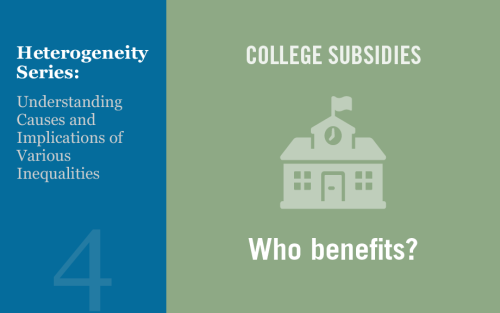
Introduction to Heterogeneity Series: Understanding Causes and Implications of Various Inequalities
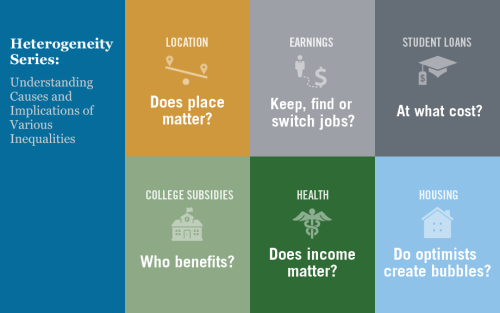
Economic analysis is often geared toward understanding the average effects of a given policy or program. Likewise, economic policies frequently target the average person or firm. While averages are undoubtedly useful reference points for researchers and policymakers, they don’t tell the whole story: it is vital to understand how the effects of economic trends and government policies vary across geographic, demographic, and socioeconomic boundaries. It is also important to assess the underlying causes of the various inequalities we observe around us, be they related to income, health, or any other set of indicators. Starting today, we are running a series of six blog posts (apart from this introductory post), each of which focuses on an interesting case of heterogeneity in the United States today.
Posted at 7:00 am in Education, Equitable Growth, Household Finance, Inequality, Labor Market, Regional Analysis | Permalink
August 13, 2019
Just Released: Mind the Gap in Delinquency Rates

Total household debt balances increased by $192 billion in the second quarter of 2019, boosted primarily by a $162 billion gain in mortgage installment balances, according to the latest Quarterly Report on Household Debt and Credit from the New York Fed’s Center for Microeconomic Data (the mortgage installment balances exclude home equity lines of credit, which are reported separately and have been declining in balance for some time). The new mortgage total of $9.4 trillion is slightly higher than the previous high in mortgage balances from the third quarter of 2008 in nominal terms.
May 23, 2019
New China Tariffs Increase Costs to U.S. Households

Amiti, Redding, and Weinstein consider the cost of higher U.S. tariffs on imports from China to the typical American household.
 RSS Feed
 Follow Liberty Street Economics