


226 posts on "Household Finance"
September 21, 2020
How Did State Reopenings Affect Small Businesses?

In our previous post, we looked at the effects that the reopening of state economies across the United States has had on consumer spending. We found a significant effect of reopening, especially regarding spending in restaurants and bars as well as in the healthcare sector. In this companion post, we focus specifically on small businesses, using two different sources of high-frequency data, and we employ a methodology similar to that of our previous post to study the effects of reopening on small business activity along various dimensions. Our results indicate that, much like for consumer spending, reopenings had positive and significant effects in the short term on small business revenues, the number of active merchants, and the number of employees working in small businesses. It is important to stress that we are not expressing any views in this post on the normative question of whether, when, or how states should loosen or tighten restrictions aimed at controlling the COVID-19 pandemic.
Posted at 7:00 am in Crisis, Employment, Household Finance, Labor Market, Macroeconomics, Pandemic, Unemployment | Permalink
August 19, 2020
August 18, 2020
Debt Relief and the CARES Act: Which Borrowers Benefit the Most?
COVID-19 and associated social distancing measures have had major labor market ramifications, with massive job losses and furloughs. Millions of people have filed jobless claims since mid-March—6.9 million in the week of March 28 alone. These developments will surely lead to financial hardship for millions of Americans, especially those who hold outstanding debts while facing diminishing or disappearing wages. The CARES Act, passed by Congress on April 2, 2020, provided $2.2 trillion in disaster relief to combat the economic impacts of COVID-19. Among other measures, it included mortgage and student debt relief measures to alleviate the cash flow problems of borrowers. In this post, we examine who could benefit most (and by how much) from various debt relief provisions under the CARES Act.
Posted at 7:00 am in Equitable Growth, Household Finance, Housing, Inequality | Permalink | Comments (2)
August 17, 2020
Are Financially Distressed Areas More Affected by COVID‑19?
Building upon our earlier Liberty Street Economics post, we continue to analyze the heterogeneity of COVID-19 incidence. We previously found that majority-minority areas, low-income areas, and areas with higher population density were more affected by COVID-19. The objective of this post is to understand any differences in COVID-19 incidence by areas of financial vulnerability. Are areas that are more financially distressed affected by COVID-19 to a greater extent than other areas? If so, this would not only further adversely affect the financial well-being of the individuals in these areas, but also the local economy. This post is the first in a three part-heterogeneity series looking at heterogeneity in the credit market as it pertains to COVID-19 incidence and CARES Act debt relief.
August 13, 2020
The Disproportionate Effects of COVID‑19 on Households with Children

A growing body of evidence (here, here, and here) points to large negative economic and health impacts of the COVID-19 pandemic on low-income, Black, and Hispanic Americans. Beyond the consequences of school cancellations and lost social interactions, there exists considerable concern about the long-lasting effects of economic hardship on children. In this post, we assess the extent of the underlying economic and financial strain faced by households with children living at home, using newly collected data from the monthly Survey of Consumer Expectations (SCE).
August 6, 2020
A Monthly Peek into Americans’ Credit During the COVID‑19 Pandemic

Total household debt was roughly flat in the second quarter of 2020, according to the latest Quarterly Report on Household Debt and Credit from the New York Fed’s Center for Microeconomic Data. But, for the first time, the dynamics in household debt balances were driven primarily by a sharp decline in credit card balances, as consumer spending plummeted. In an effort to gain greater clarity, the New York Fed and the Federal Reserve System have acquired monthly updates for the New York Fed Consumer Credit Panel, based on anonymized Equifax credit report data. We’ve been closely watching the data as they roll in, and here we present six key takeaways on the consumer balance sheet in the months since COVID-19 hit.
July 8, 2020
Medicare and Financial Health across the United States
Consumer financial strain varies enormously across the United States. One pernicious source of financial strain is debt in collections—debt that is more than 120 days past due and that has been sold to a collections agency. In Massachusetts, the average person has less than $100 in collections debt, while in Texas, the average person has more than $300. In this post, we discuss our recent staff report that exploits the fact that virtually all Americans are universally covered by Medicare at 65 to show that health insurance not only improves financial health on average, but also is a major explanation for the heterogeneity in financial strain across the country. We find that Medicare affects different parts of the United States differently and plays a particularly important role in improving financial health in the least advantaged areas.
Do College Tuition Subsidies Boost Spending and Reduce Debt? Impacts by Income and Race
In an October post, we showed the effect of college tuition subsidies in the form of merit-based financial aid on educational and student debt outcomes, documenting a large decline in student debt for those eligible for merit aid. Additionally, we reported striking differences in these outcomes by demographics, as proxied by neighborhood race and income. In this follow-up post, we examine whether and how this effect passes through to other debt and consumption outcomes, namely those related to autos, homes, and credit cards. We find that access to merit aid leads to an immediate but temporary increase in eligible individuals’ consumption in these categories. The increase is followed by a decline in consumption and a reduction in total debt of these types in the longer term. Importantly, there are marked differences in these consumption and debt patterns across groups, as evident when we introduce proxies for demographic group using the income and racial composition of the students’ home neighborhoods of origin.
Measuring Racial Disparities in Higher Education and Student Debt Outcomes
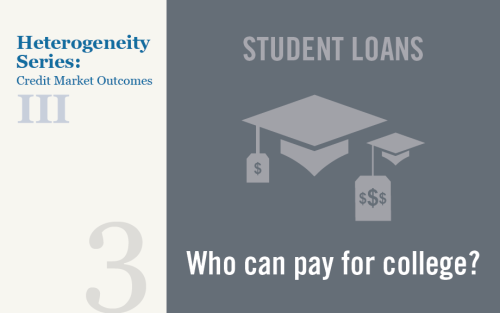
Across the United States, the cost of all types of higher education has been rising faster than overall inflation for more than two decades. Despite rising costs, aggregate undergraduate enrollment rose steadily between 2000 and 2010 before leveling off and dipping slightly to its current level. Rising college costs have steadily increased dependence on student debt for college financing, with many students and parents turning to federal and private loans to pay for higher education. An earlier post in this series reported that borrowers in majority Black areas have higher student loan balances and rates of default than those in both majority white and majority Hispanic areas. In this post, we study how differences in college attendance rates and in the types of colleges attended generate heterogeneity in loan experiences. Specifically, using nationwide data, we analyze heterogeneities in college-going and heterogeneities in student debt and default experiences by college type across individuals living in majority Black, majority Hispanic, and majority white zip codes.
Posted at 7:30 am in Education, Equitable Growth, Household Finance, Inequality, Student Loans | Permalink
Inequality in U.S. Homeownership Rates by Race and Ethnicity
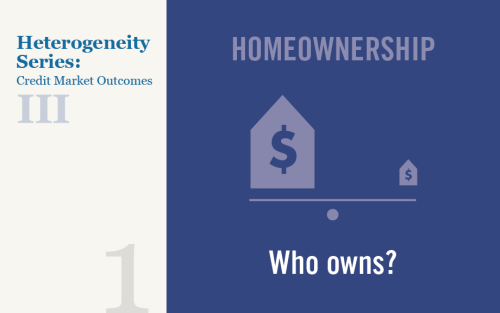
Homeownership has historically been an important means for Americans to accumulate wealth—in fact, at more than $15 trillion, housing equity accounts for 16 percent of total U.S. household wealth. Consequently, the U.S. homeownership cycle has triggered large swings in Americans’ net worth over the past twenty-five years. However, the nature of those swings has varied significantly by race and ethnicity, with different demographic groups tracing distinct trajectories through the housing boom, the foreclosure crisis, and the subsequent recovery. Here, we look into the dynamics underlying these divergences and explore some potential explanations.
 RSS Feed
 Follow Liberty Street Economics