


44 posts on "Student Loans"
April 21, 2022
What Might Happen When Student Loan Forbearance Ends?
Federal student loan relief was recently extended through August 31, 2022, marking the sixth extension during the pandemic. Such debt relief includes the suspension of student loan payments, a waiver of interest, and the stopping of collections activity on defaulted loans. The suspension of student loan payments was expected to help 41 million borrowers save an estimated $5 billion per month. This post is the first in a two-part series exploring the implications and distributional consequences of policies that aim to address the student debt burden. Here, we focus on the uneven consequences of student debt relief and its withdrawal. With the end-date of the student loan relief drawing near, a key question is whether and how the discontinuation of student debt relief might affect households. Moreover, will these effects vary by demographics?
Posted at 11:00 am in Credit, Education, Equitable Growth, Household Finance, Pandemic, Student Loans | Permalink
March 22, 2022
Student Loan Repayment during the Pandemic Forbearance

The onset of the COVID-19 pandemic brought substantial financial uncertainty for many Americans. In response, executive and legislative actions in March and April 2020 provided unprecedented debt relief by temporarily lowering interest rates on Direct federal student loans to 0 percent and automatically placing these loans into administrative forbearance. As a result, nearly 37 million borrowers have not been required to make payments on their student loans since March 2020, resulting in an estimated $195 billion worth of waived payments through April 2022. However, 10 million borrowers with private loans or Family Federal Education Loan (FFEL) loans owned by commercial banks were not granted the same relief and continued to make payments during the pandemic. Data show that Direct federal borrowers slowed their paydown, with very few making voluntary payments on their loans. FFEL borrowers, who were not covered by the automatic forbearance, struggled with their debt payments during this time. The difficulties faced by these borrowers in managing their student loans and other debts suggest that Direct borrowers will face rising delinquencies once forbearance ends and payments resume.
November 17, 2021
Uneven Distribution of Household Debt by Gender, Race, and Education
Household debt has risen markedly since 2013 and amounts to more than $15 trillion dollars. While the aggregate volume of household debt has been well-documented, literature on the gender, racial and education distribution of debt is lacking, largely because of an absence of adequate data that combine debt, demographic, and education information. In a three-part series beginning with this post, we seek to bridge this gap. In this first post, we focus on differences in debt holding behavior across race and gender. Specifically, we explore gender and racial disparities in different types of household debt and delinquencies—for auto, mortgage, credit card, and student loans—while distinguishing between students pursuing associate’s (AA) and bachelor’s (BA) degrees. In the second post in this series, we investigate gender and racial disparities in delinquencies across these various kinds of consumer debt. We close with a third post where we try to understand some of the mechanisms behind differences in debt and delinquencies across gender and race.
February 17, 2021
Mortgage Rates Decline and (Prime) Households Take Advantage

Today, the New York Fed’s Center for Microeconomic Data reported that household debt balances increased by $206 billion in the fourth quarter of 2020, marking a $414 billion increase since the end of 2019. But the COVID pandemic and ensuing recession have marked an end to the dynamics in household borrowing that have characterized the expansion since the Great Recession, which included robust growth in auto and student loans, while mortgage and credit card balances grew more slowly. As the pandemic took hold, these dynamics were altered. One shift in 2020 was a larger bump up in mortgage balances. Mortgage balances grew by $182 billion, the biggest uptick since 2006, boosted by historically high volumes of originations. Here, we take a close look at the composition of mortgage originations, which neared $1.2 trillion in the fourth quarter of 2020, the highest single-quarter volume seen since our series begins in 2000. The Quarterly Report on Household Debt and Credit and this analysis are based on the New York Fed’s Consumer Credit Panel, which is itself based on anonymized Equifax credit data.
Posted at 11:00 am in Credit, Household Finance, Housing, Pandemic, Recession, Student Loans | Permalink
July 8, 2020
Do College Tuition Subsidies Boost Spending and Reduce Debt? Impacts by Income and Race
In an October post, we showed the effect of college tuition subsidies in the form of merit-based financial aid on educational and student debt outcomes, documenting a large decline in student debt for those eligible for merit aid. Additionally, we reported striking differences in these outcomes by demographics, as proxied by neighborhood race and income. In this follow-up post, we examine whether and how this effect passes through to other debt and consumption outcomes, namely those related to autos, homes, and credit cards. We find that access to merit aid leads to an immediate but temporary increase in eligible individuals’ consumption in these categories. The increase is followed by a decline in consumption and a reduction in total debt of these types in the longer term. Importantly, there are marked differences in these consumption and debt patterns across groups, as evident when we introduce proxies for demographic group using the income and racial composition of the students’ home neighborhoods of origin.
Measuring Racial Disparities in Higher Education and Student Debt Outcomes
Across the United States, the cost of all types of higher education has been rising faster than overall inflation for more than two decades. Despite rising costs, aggregate undergraduate enrollment rose steadily between 2000 and 2010 before leveling off and dipping slightly to its current level. Rising college costs have steadily increased dependence on student debt for college financing, with many students and parents turning to federal and private loans to pay for higher education. An earlier post in this series reported that borrowers in majority Black areas have higher student loan balances and rates of default than those in both majority white and majority Hispanic areas. In this post, we study how differences in college attendance rates and in the types of colleges attended generate heterogeneity in loan experiences. Specifically, using nationwide data, we analyze heterogeneities in college-going and heterogeneities in student debt and default experiences by college type across individuals living in majority Black, majority Hispanic, and majority white zip codes.
Posted at 7:30 am in Education, Equitable Growth, Household Finance, Inequality, Student Loans | Permalink
July 7, 2020
Introduction to Heterogeneity Series III: Credit Market Outcomes
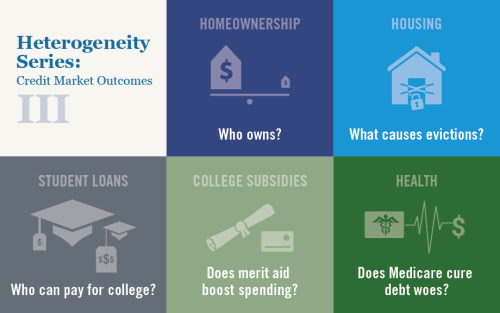
Following up series on heterogeneity and inequality broadly and in labor market outcomes specifically, we turn our focus to further documenting heterogeneity in credit market outcomes, looking at disparities in home ownership rates, varying exposure to evictions, differing gains from tuition support and Medicare programs, and more.
December 13, 2019
Tariffs, Auto Loans, Rising College Costs, and Other Top LSE Posts of 2019
At year end, we look back at the top five most-read Liberty Street Economics posts of 2019.
November 13, 2019
Just Released: Racial Disparities in Student Loan Outcomes

A $20 billion rise in student loan balances in the third quarter of this year contributed to a $92 billion increase in total household debt, according to the latest Quarterly Report on Household Debt and Credit from the New York Fed’s Center for Microeconomic Data. This post explores racial disparities in student loan outcomes using information about the borrowers’ locations, grouping zip codes based upon which racial group constitutes the majority of an area’s residents.
October 9, 2019
Who Borrows for College—and Who Repays?
Student loans are increasingly a focus of discourse among politicians, policymakers, and the news media, resulting in a range of new ideas to address the swelling aggregate debt. Evaluating student loan policy proposals requires understanding the challenges faced by student borrowers. In this post, we explore the substantial variation in the experiences of borrowers and consider the distributional effects of various policy options.
 RSS Feed
 Follow Liberty Street Economics