Richard K. Crump and Ayşegül Şahin
Recessions and recoveries typically have been times of substantial reallocation in the economy and the labor market, and the current cycle does not appear to be an exception. The speed and smoothness of reallocation depend in part on the structure of the labor market, particularly the degree of mismatch between the characteristics of available workers and newly available jobs. Such mismatches could occur because of differences in skills between workers and jobs (skills mismatch) or because of differences in the location of the available jobs and available workers (geographic mismatch). In this post, we focus on skills mismatch to assess the extent to which the slow pace of the labor market recovery from the Great Recession can be attributed to such problems. If skills mismatch is much more severe than usual, we would expect the unemployment rate to remain higher for longer and the workers subject to such mismatch to have worse labor market outcomes.
We concentrate particularly on construction workers, who many have thought are prone to a high degree of skills mismatch because of the housing boom and bust. Contrary to this view, we find that (1) general measures of mismatch, after rising sharply in the recession, are now near their pre-recession level as they continue to display a pronounced cyclical pattern; and (2) construction workers are not experiencing relatively worse labor market outcomes.
Skills Mismatch in the U.S. Economy
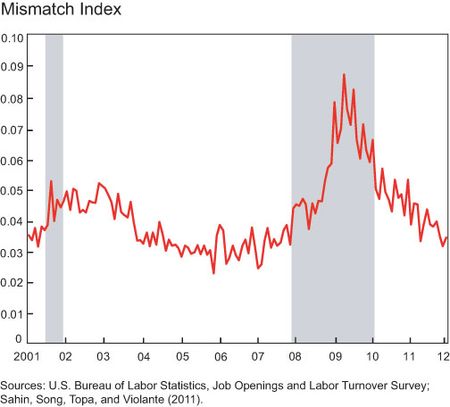
We measure skills mismatch using the index developed in Şahin, Song, Topa, and Violante (2011). This index is based upon the number of vacancies (that is, job openings, a measure of labor demand) and the number of unemployed workers (a measure of labor supply). By comparing these variables across the economy (for example, across industries), the authors create a measure of overall mismatch in the labor market. An increasing imbalance between the shares of vacancies and unemployed workers across industries is a sign of greater mismatch.
Based on this mismatch index, we conclude the following: First, the index displays considerable cyclicality, increasing notably in recessions. Second, the index has fallen appreciably during this recovery and is now near its pre-recession level. This pattern suggests that although mismatch rose considerably during the Great Recession, that rise proved temporary.
The Plight of Construction Workers
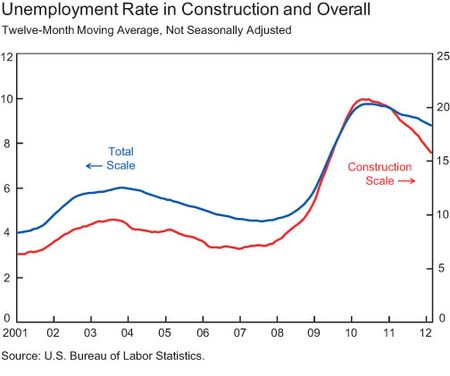
Because of the role of the housing boom and bust in the Great Recession and the continued depressed state of the housing market, concerns have arisen about the labor market prospects of construction workers. We investigate this issue through measures of labor supply and demand in the industry. Comparing the unemployment rate for those previously employed in construction with the overall unemployment rate, we find that the improvement in the unemployment rate for construction workers has been notable relative to the overall unemployment rate. That said, the rate for these workers remains at a high level of approximately 16 percent (note the differing scales for the two variables in the chart below).
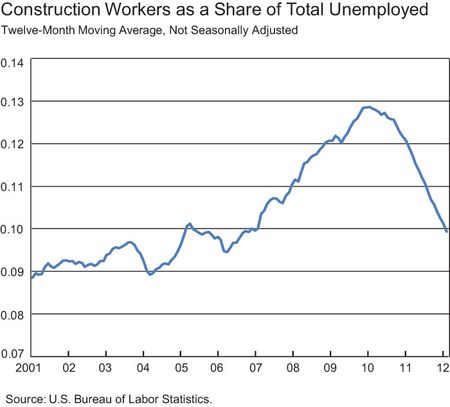
The current construction unemployment rate is approximately double its level over 2001-07. There are about 1.35 million unemployed construction workers—about 10 percent of total unemployed workers. Nevertheless, as seen in the next chart, the construction share of unemployed workers has dropped substantially from its highs in the recession and is only slightly above its average of about 9.5 percent over 2001-07, even though the unemployment rate remains elevated.
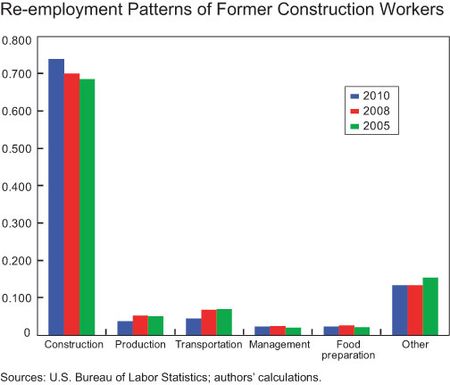
As we have stressed earlier in this series, focusing only on unemployment is not necessarily the best measure of the health of the labor market. For example, former construction workers may exit unemployment by leaving the labor force rather than finding jobs. To obtain a better sense of labor market conditions for construction workers, we first look at their job finding rate. We need to be careful in interpreting this rate for a particular occupation because unemployed workers may change occupations. However, as seen in the chart below (based on a “Chart of the Day” from the San Francisco Fed), a large majority of the unemployed construction workers who are re-employed take new jobs in construction. Moreover, the housing boom and bust appears to have had only minor effects on this pattern.
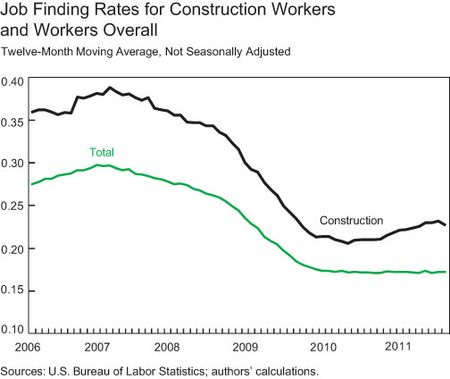
With this observation in mind, we compare the job finding rate for construction workers with the overall job finding rate and find that the rates have displayed similar patterns in recent years (see chart below). (We have also looked at a number of other substitute and skilled occupations and arrived at similar conclusions.) In fact, the job finding rate in construction actually has improved more since mid-2010 than has the overall rate.
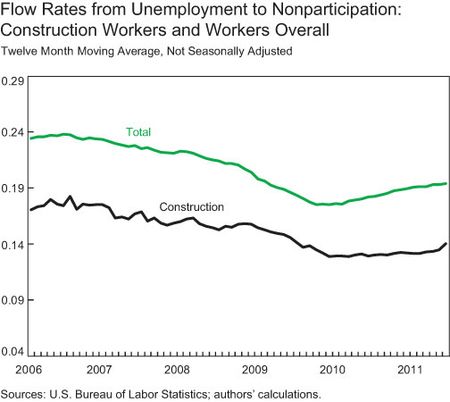
Even though construction workers do not appear to be faring worse than other workers in finding new jobs, they may still be leaving the labor force more than other unemployed workers in this cycle. However, as the next chart shows, the flow of construction workers from unemployment to nonparticipation has remained below that of the overall labor force in recent years. In addition, even though this flow for construction has shown a bit of an upward trend recently, its ris
e is clearly less pronounced than that for the total labor market.
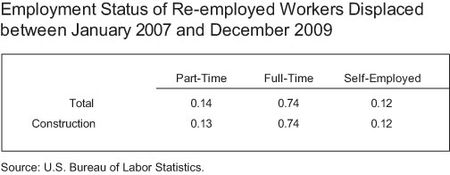
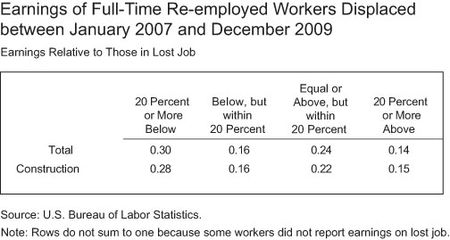
To secure employment, construction workers may have had to make greater concessions than other workers. We address this issue using the Displaced Worker Survey from the Bureau of Labor Statistics, which summarizes the experiences of workers who were displaced in 2007-09 from jobs they had held for at least three years. The survey suggests that construction workers have not made more concessions than other workers. The shares of displaced construction workers who have been re-employed by becoming self-employed or by taking part-time jobs are similar to those of overall displaced workers. Re-employed construction workers also have a similar distribution of current wages relative to the wages they earned in their previous job as overall displaced workers. Note that this survey was taken in January 2010, before the upward rise in the job finding rate of construction workers presented earlier.
Disclaimer
The views expressed in this blog are those of the authors and do not necessarily reflect the position of the Federal Reserve Bank of New York or the Federal Reserve System. Any errors or omissions are the responsibility of the authors.


 RSS Feed
 Follow Liberty Street Economics
An interesting article certainly. It may presage a better recovery than currently anticipated. But the economy appears to be struggling in terms of producing new jobs. Why is that? Governments at the state and municipal level are laying lots of people off. Is that where the struggle now resides? Or is the anxiety coming from elsewhere? Where are incomes now compared to pre-Great Recession? The article implies some degredation within the construction industry, but not much. Are we just suffering from a longterm trend where higher paying manufacturing jobs are gone in numbers large enough to substantially degrade overall income levels as people migrate to lower paying service jobs?
It is very interesting article. About 75% of the people who have been unemployed during the peak of recession have been reemployed. Additionally the loss of pay of more than 20% has affected about 30%. Therefore in total about 60% of the unemployed have their earning restored. Now try to use this statistics with houses already foreclosed or are seriously delinquent. I have seen many studies done by labor economist and housing economist, but somehow I have not seen studies where each other have done a close look at each other’s work. All this has important policy implications. If 75% of the unemployed people are finding the jobs and if there is a housing delinquency due to unemployment then in 75% of case delinquency is temporary. Policy makers should look at the fact and say housing problem is due to high uemployment.