


Matthew Higgins and Thomas Klitgaard
Euro area periphery countries borrowed heavily from abroad in the run-up to the sovereign debt crisis. How were these funds used? In this post, we recap our recent Current Issues study, showing that pre-crisis borrowing by the periphery countries (Greece, Ireland, Portugal, and Spain) went mainly to finance private consumption or housing booms rather than productivity-enhancing investments. Most analysis of the crisis has focused on the need for fiscal adjustment in the periphery. A look at the drivers of the run-up in foreign borrowing, however, suggests that private spending in the periphery will also need to move to a lower plane. The fact that debts were built up without adding to these countries’ productive capacity is likely to make the needed adjustment in spending all the more difficult.
A country’s current account balance is equal to the difference between domestic saving and domestic investment spending. A country that saves more than is needed to support domestic capital expenditures sends the surplus abroad to purchase foreign assets. Conversely, a country where domestic saving is insufficient to finance domestic capital expenditures must borrow from abroad to make up the shortfall. After all, a country that saves more than it invests also produces more than it consumes. Through cross-border lending and borrowing, countries with surpluses build up a store of foreign wealth, while countries with deficits are able to maintain higher levels of consumption and investment spending than would be possible without foreign financing.
In 2007, during the run-up to the global financial crisis, Greece, Portugal, and Spain borrowed amounts equivalent to 10 to 15 percent of GDP, the largest in the euro area (chart below). Ireland’s borrowing, though smaller, was still a substantial 5 percent of GDP. Now, these countries face pressure to bring spending in line with income.

Whether a current account deficit develops because of higher investment or reduced saving matters for assessing risks to growth and financial stability. Foreign borrowing to finance productive investment projects raises national income and should result in a surplus over debt service costs. Foreign borrowing undertaken because of lower levels of saving, in contrast, supports current consumption while building up a debt burden on future income. The composition of investment can also matter. For example, foreign borrowing to support investment in nontradable sectors such as housing generates no foreign income stream to support repayment.
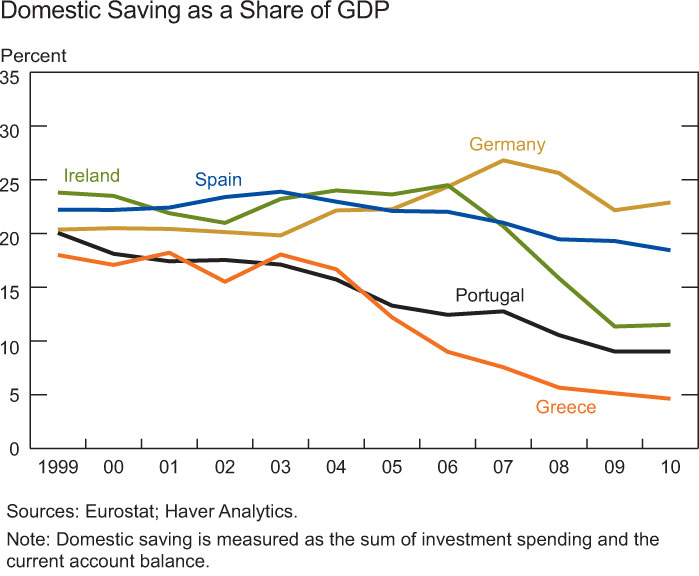
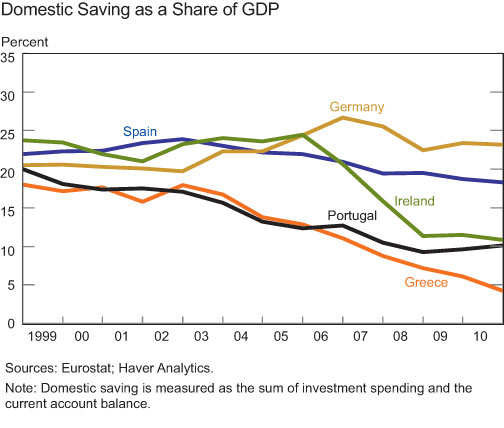
The saving-investment mix in the euro area periphery countries was not healthy from a growth and stability perspective in the period leading up to the global recession. Consider first developments on the saving side. Greece and Portugal saw large drops in domestic saving (chart below). In Greece, saving fell to just 11 percent of GDP in 2007; in Portugal, it fell to just 13 percent. More detailed national accounts data from the Organisation for Economic Co-operation and Development show that Greece’s decline in saving was mostly attributable to lower private saving but also to larger government budget deficits. The decline in Portugal was entirely attributable to lower private saving. Spain showed a modest decline in its saving rate up to 2007, with lower private saving outweighing the impact of improved government fiscal balances in the period leading up to the recession. Ireland displayed a relatively stable saving rate, with little change on either the private or the government side. Germany, in contrast, saw a marked increase in its saving rate, from 21 percent of GDP in 1999 to 27 percent by 2007, mostly driven by higher private saving.

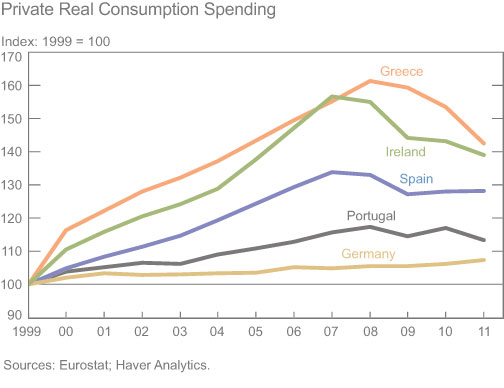
The divergence in saving trends is mirrored in consumption trends, as euro area periphery households responded to lower interest rates by borrowing and spending. Real consumption spending in Ireland and Greece increased roughly 55 percent from 1999 to 2007 (chart below). In Spain, the corresponding figure was around 35 percent. Again, Germany stands at the other extreme. Consumption remained essentially flat after 2001, leaving the country with ample funds to lend abroad. Similarly, household liabilities ballooned in the periphery countries, far outpacing growth in disposable income, while liabilities declined relative to disposable income in Germany. These divergent consumer spending trends were a key driver of euro area imbalances.

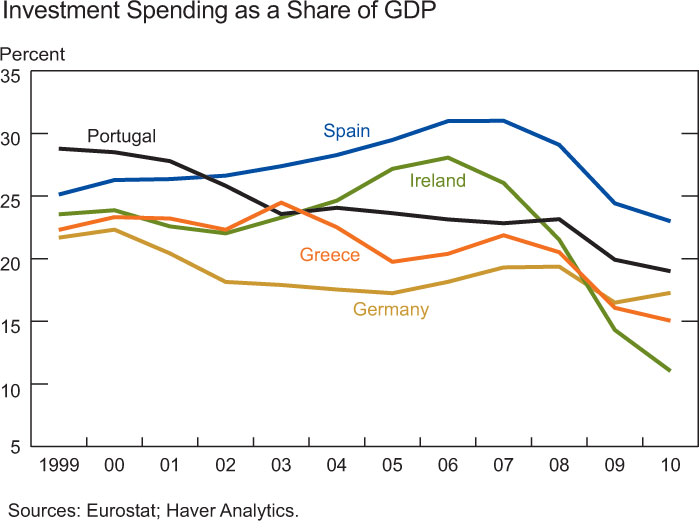
Now consider developments on the investment side. Investment spending as a share of GDP declined slightly in Greece leading up to the crisis, while the investment share in Portugal was flat (chart below). In contrast, investment spending as a share of GDP saw a marked rise in Spain and Ireland. But higher investment shares in these two countries reflected booms in residential construction—both countries saw enormous house-price bubbles—rather than spending on business plants and equipment.

In sum, heavy foreign borrowing offset low saving rates in Greece and Portugal, while in Spain and Ireland it was used to fuel a housing boom. But the outcome for all four countries was the same: they accumulated foreign debt but did not use these funds to build up the higher productive capacity that would enable them to repay or service the debt.
Reduced foreign borrowing in the euro area periphery countries will require higher domestic saving relative to domestic investment spending. One set of adjustment policies focuses on increasing national saving through fiscal austerity measures. Needless to say, cutbacks in government spending or hikes in taxes put downward pressure on output and incomes. The advantage of fiscal policy is that tightening measures are simple to identify, even if painful to implement. The drawback is that austerity measures can be self-defeating by choking off growth and undermining the economy’s tax base (see recent analysis in the International Monetary Fund’s World Economic Outlook).
Private sector behavior will also play an important role in the future evolution of periphery countries’ saving-investment balances. Household saving rates typically rise during downturns, with consumers turning cautious amid increased uncertainty. And indeed, household saving rates rose substantially after 2007 in Ireland, Portugal, and Spain, the three periphery countries for which we have data. Business saving rates, in contrast, typically fall, reflecting weakness in corporate profits during downturns. However, business investment generally declines at least as sharply, so that the private saving-investment balance improves and thereby reduces external borrowing. In line with this pattern, Ireland, Portugal, and Spain saw business investment other than housing fall by more than 20 percent in real terms from 2007 to 2011. The rub, of course, is that lower business investment spending is the least attractive way of responding to reduced foreign financing, given the link between business investment and future productivity.
The key question is how the periphery countries will adjust going forward. Foreign borrowing remains sizeable outside Ireland, although current account deficits in 2011 were well below pre-crisis peaks. The positive shift in current account balances in all four countries reflects lower saving rates alongside larger declines in investment spending, with residential as well as business investment weakening. Notably, sizeable foreign borrowing has been maintained despite the drying up of private investment inflows; indeed, once-substantial inflows have given way to liquidation of existing positions. Ongoing current account deficits in the periphery have been financed instead by official creditors, including adjustment assistance by the International Monetary Fund and European Union, and the automatic extension of central bank credit from surplus countries in the euro area via the region’s banking payments system (see our recent Liberty Street blog post for details). (Liquidation of periphery countries’ own external assets has also played a role.) However, the ability or willingness of the official creditors to provide additional funding surely has limits. With the loss of access to foreign capital, periphery countries now face the difficult task of bringing private and public spending back in line with domestic incomes.
Disclaimer
The views expressed in this blog are those of the authors and do not necessarily reflect the position of the Federal Reserve Bank of New York, or the Federal Reserve System. Any errors or omissions are the responsibility of the authors.
 RSS Feed
 Follow Liberty Street Economics
This above dynamic is especially important for understanding Spain, where sovereign debt levels (at least those officially reported) are not particularly high. Spain’s housing bubble, however, continues to decline putting further pressure on private sector balance sheets. The public and private sectors cannot both successfully deleverage, in tandem, without destroying incomes and growth. Debts that cannot be repaid, will not be repaid. Private sector debts in periphery Europe, as well as the US and UK, must be brought back in line with incomes to support any sustainable future growth. The options for achieving this are either nominal income growth above debt servicing costs, debt write-downs, or a combination of the two. So far, policy in Europe seems to be attempting neither and the situation continues to worsen (unemployment is currently at a 15-year high). If there is any hope for a peaceful resolution of the Eurozone crisis, policy makers must begin to focus on correcting private sector debt imbalances. http://bubblesandbusts.blogspot.com/2012/05/private-debt-continues-to-drag-down.html