Correction: This post was updated on December 10, 2014, to correct the bilateral repo estimates in the table and charts. We also corrected the text explaining the method to construct the bilateral repo estimates.
The repurchase agreement (repo), a contract that closely resembles a collateralized loan, is widely used by financial institutions to lend to each other. The repo market is divided into trades that settle on the books of the two large clearing banks (that is, tri-party repo) and trades that do not (that is, bilateral repo). While there are public data about the tri-party repo segment, there is little to no information on the bilateral repo segment. In this post, we update a methodology we developed earlier to estimate the size and composition of collateral posted for bilateral repos, and find that U.S. Treasury securities are the dominant form of collateral for bilateral repos. This new finding implies that the collateral posted for bilateral repos is of higher quality than the collateral posted for tri-party repos.
The idea behind our estimate is simple: Primary dealers provide information about their total repo activity by type of collateral, but this information does not distinguish between the bilateral and tri-party repo segments. We also have data on the collateral posted in tri-party repo. For each asset class we consider, we can deduct the activity in the tri-party repo (including the gross amounts traded in GCF Repo®) from the activity in the overall repo figure reported by primary dealers to obtain an estimate of the amount of collateral financed in the bilateral repo segment. In this post, we focus on dealers’ repo activity, but a similar approach can be taken to estimate dealers’ reverse repo activity in the bilateral repo segment.
To obtain these estimates, we exploit the fact that since April 2013, primary dealers report more details about the collateral backing their financing transactions. Before the most recent revisions to the Federal Reserve FR2004 reporting form (for government securities dealers), repo activity by primary dealers was aggregated across all collateral classes, which limits the usefulness of the data for analyzing trends in repo collateral.
To compare the repo numbers across the various data sources, we have to make some adjustments. First, the FR2004 data include only primary dealer activity, whereas the tri-party repo and GCF Repo® figures include repos by all dealers. To make these numbers comparable, we extrapolate from the tri-party repo activity and assume that primary dealers make up a little less than 80 percent of all repos in the United States. Second, using the public tri-party repo numbers, we calculate the amount of funds received by dealers (what is measured in the FR2004 data) by multiplying the total amount of collateral posted by 1 minus the median margin (for each collateral class). There are no margins in GCF Repo®, and so no adjustment is necessary. Third, the tri-party repo data is a mix of repo and pledge trades, whereas in the FR2004 data, pledges are reported in “other financing activity, securities lent.” Taking advantage of the fact that the value of “other financing activity, securities lent” is small relative to repo, in our analysis we use “total securities out” in FR2004 (“repo” plus “other financing activity, securities lent”). The ratio of repo to total securities out averages 86 percent from April 2013 to October 2014, and increases to 94 percent when we focus just on the U.S. Treasury asset class. As such, our estimates of bilateral repo, and especially of bilateral repo involving Treasury securities, will be only slightly overestimated. Fourth and finally, the timing of data releases across these data sources does not match up exactly—but the FR2004 data releases are typically no more than one or two days off from the publicly available tri-party repo and GCF Repo® data releases.
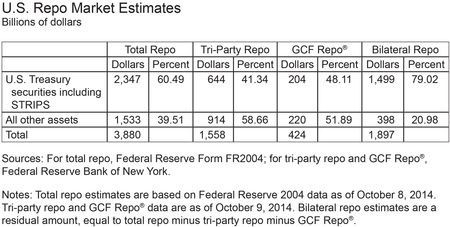
Unfortunately, the definitions and groupings of collateral differ across the data sources. Equities, for example, have a more inclusive definition in the tri-party repo data relative to the FR2004 data. Because of this, we aggregate the data up to Treasury securities including STRIPS and all other assets. With this approach, we obtain the following breakdown of the collateral for October 9, 2014.
The striking fact is that Treasury securities make up 79 percent of the collateral posted in bilateral repo. Other securities, such as agency mortgage-backed securities (MBS), agency debt, corporate bonds, and equities, are posted as collateral in bilateral repo trades, but only to a limited extent. In contrast to bilateral repo, Treasury securities play a much smaller role in tri-party repo. Treasury securities are posted as collateral for roughly 40 percent of tri-party repo trades, about the same share as agency MBS.
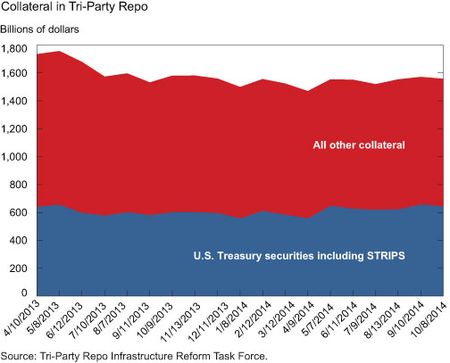
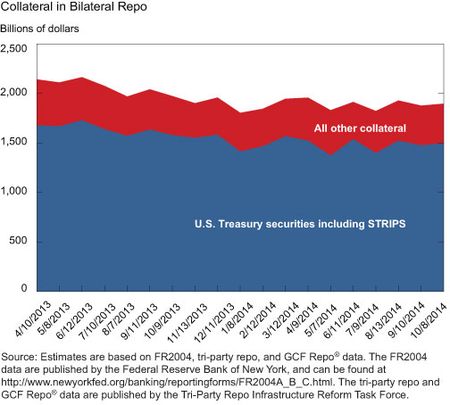
These estimated shares of collateral posted are not specific to October 9, 2014. As illustrated in the two charts below, Treasury securities’ share of total collateral posted is fairly stable over time for both bilateral and tri-party repo (although the data go back only to April 2013). Additionally, the amount of activity in bilateral repo relative to tri-party repo is stable over the sample period.
The dominant use of Treasury securities as collateral in bilateral repos is reportedly driven in part by demand for specific Treasury securities. Tri-party repo is not conducive to these collateral-driven trades because tri-party repos are designed to be general collateral trades, which means that the institution delivering cash agrees to accept securities within a broad collateral class (for example, investment grade bonds, or U.S. Treasury securities with maturities less than ten years). As such, if a financial institution is looking for a particular piece of collateral, such as an on-the-run Treasury security, then bilateral repos are the more appropriate way to obtain that security compared to tri-party repo. Securities lending transactions are another way to acquire specific securities (see this New York Fed Current Issues article by Frank Keane for an up-to-date description of these types of trades).
Another reason why tri-party repo trades are secured by a wider range of collateral, compared with bilateral repos, may be costs of settlement. The main feature of tri-party repo is that the back-office work of clearing and settling the repos is done by one of two clearing banks. In contrast, clearing and settling bilateral repos is the responsibility of the trading counterparties. U.S. Treasury and other securities, such as agency MBS, present starkly different costs along this dimension. According to statistics provided to the authors by the New York Fed, there were more than 1 million agency MBS outstanding (as measured by CUSIP) as of December 2012. In contrast, there were fewer than 350 U.S. Treasury securities outstanding. The large fixed costs necessary to clear and settle agency MBS may dissuade the acceptance of these securities as collateral for bilateral repo. For tri-party repo, however, the clearing banks can take ad
vantage of returns to scale and so offer to clear and settle a wide range of securities.
Our estimates provide more information on one of the more obscure parts of the U.S. financial system, the bilateral repo segment. The news is reassuring, because it suggests that the quality of the collateral posted in bilateral repos is high overall. Nevertheless, we would like to know a lot more about the repo market as a whole, and the bilateral segment in particular. For example, to what extent are tri-party repo and bilateral repo trades substitutes for one another, or do dealers use these two segments in a complementary manner? Of particular interest is the amount of bilateral repo that is interdealer, the extent to which bilateral repo trades reflect activity driven by demand for specific securities, and the velocity of securities among dealers within a day. Among the data that would help us better understand the U.S. repo market are the level of haircuts, the size, the interest rate, the counterparty, and the tenor of trades. Some of these data are available for the tri-party repo market, but not for the bilateral market. So while we are able to shine a little bit more light on the U.S. repo market, we continue to need more data to further our understanding of this critical market.
Disclaimer
The views expressed in this post are those of the authors and do not necessarily reflect the position of the Federal Reserve Bank of New York or the Federal Reserve System. Any errors or omissions are the responsibility of the authors.

Adam Copeland is a senior financial economist in the Federal Reserve Bank of New York’s Research and Statistics Group.

Isaac Davis is a senior research analyst in the Bank’s Research and Statistics Group.

Eric LeSueur is a policy and market analysis associate in the Federal Reserve Bank of New York’s Markets Group.

Antoine Martin is a vice president in the Bank’s Research and Statistics Group.


 RSS Feed
 Follow Liberty Street Economics