It is essential for policymakers and financial market participants to understand market expectations for the path of future policy rates because these expectations can have important implications for financial markets and the broader economy. In this post—which is meant to complement prior Liberty Street Economics posts, including Crump et al. (2014a, 2014b ) and Brodsky et al. (2016a, 2016b)—we offer some insights into estimating and interpreting market expectations for increases in the federal funds target range at upcoming meetings of the Federal Open Market Committee (FOMC).
In contrast to previous posts, our main focus is on analyzing market participants’ perceived probability of an increase in the federal funds target range leading up to individual upcoming FOMC meetings rather than expectations for the entire expected path for future policy rates. We focus on the current monetary policy normalization cycle that started with “liftoff” in December 2015 and has included three further rate hikes so far (in December 2016, March 2017, and June 2017). We describe the main information sources available to estimate market expectations for policy rate increases ahead of FOMC meetings, namely market- and survey-based measures, and explore how these measures compare.
Measuring Market Participants’ Expectations
With regard to market-based measures, there are several financial instruments that one could consider when trying to infer market participants’ expectations for future policy rates. In this analysis, we focus on federal funds futures, which use the effective federal funds rate (EFFR) as an underlying reference rate and are highly liquid for near-term maturities. The use of overnight indexed swaps (OIS), which also reference the EFFR, would yield qualitatively very similar results. A discussion of the differences between these instruments can be found in Crump et al. (2014a).
Given that federal funds futures contracts reference the EFFR rather than directly referencing the FOMC’s target range for the federal funds rate, we must make a few assumptions to infer policy expectations from the implied rates on these contracts. First, we make some assumptions on where the EFFR will fall within the FOMC’s target range. As shown in the chart below, the EFFR has generally been stable within the federal funds target range, apart from regular declines on month-end dates. Given this, we assume that a hike in the target range would be expected to translate into an equivalent increase in the EFFR on non-month-end dates, and also that expected month-end declines would be of comparable size to the six-month moving average of realized month-end declines.
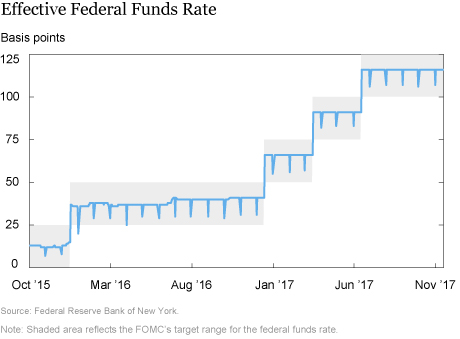
Second, to simplify matters, we assume that market participants expect the federal funds target range to either be left unchanged or to be increased by 25 basis points at a given upcoming FOMC meeting, and ignore the possibility of any intermeeting moves in the target range. Third, we assume that market participants do not place material probability on the target range being raised at two consecutive meetings. Finally, we assume that any risk premia present in near-term federal funds futures contracts can be neglected for simplicity. While risk premia have been estimated to be quite large at longer tenors, some work by economists at the Board of Governors suggests risk premia are likely small or negligible over very short horizons.
The assumptions above enable us to create a direct link between the rates implied by federal funds futures contracts and the market’s expectations for the target range set by the FOMC. We can express the market-implied EFFR after a given FOMC meeting as the following probability-weighted average:

This equation can be rearranged as below to compute the implied probability of a rate hike:

Turning to survey measures, leading up to each meeting of the FOMC, the Open Market Trading Desk of the Federal Reserve Bank of New York (the Desk) distributes its Survey of Primary Dealers and Survey of Market Participants (the “Desk surveys”). These surveys are conducted with about fifty major financial firms and provide timely insight into market expectations for the economy and monetary policy. Respondents provide not only their estimates of the most likely outcomes for monetary policy but also their subjective probability distributions for the target federal funds rate or range at various times in the future.
Recent surveys have elicited probability distributions conditional on different scenarios about the economic environment as well as the probability respondents attach to these scenarios (for further discussion, see this speech by Simon Potter). Using these responses, we are able to recover unconditional probabilities attached to rate increases at upcoming meetings that are comparable to the market-implied probabilities described above.
Evolution of Expectations
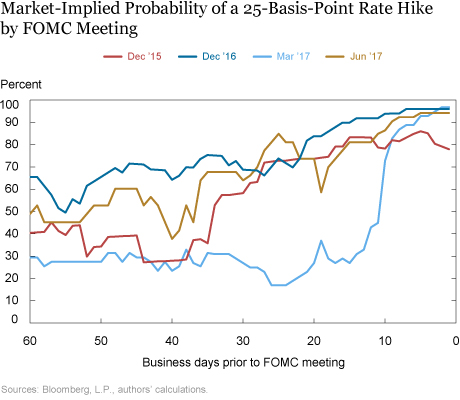
We can use these information sources to examine near-term policy expectations since the start of the current Fed normalization cycle, beginning in December 2015. The chart below shows that just prior to each of the four rate increases, the market-implied probability reflected the belief that a hike was highly likely. Although expectations look very similar close to each FOMC meeting, the evolution of those expectations over time shows quite distinct paths.
Leading up to their respective FOMC meetings, the market-implied probabilities associated with December 2015, December 2016, and June 2017 gradually increased. In contrast, the evolution of the March 2017 market-implied probability shows a more rapid rise that only took place starting fifteen business days before the meeting. The different paths leading up to each FOMC meeting partly reflect a combination of how economic data and central bank communication can affect policy expectations.
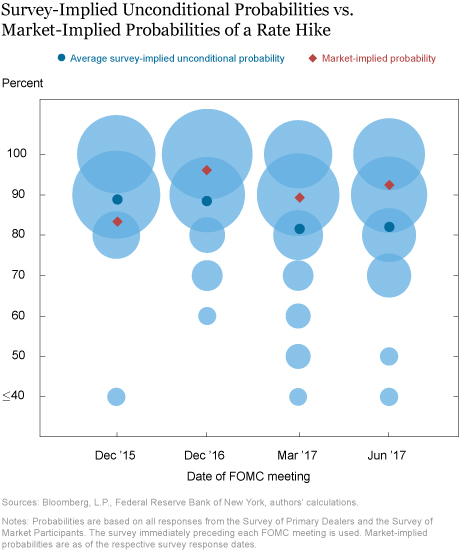
The next chart compares the market-based probabilities of a 25-basis-point rate increase at the next FOMC meeting—captured at the time of the Desk survey deadlines (usually nine days prior to every FOMC meeting)—to respondents’ unconditional probabilities from those respective surveys, shown in the light blue bubbles. The size of the bubbles indicates the share of responses around these probability levels. The chart illustrates that although there was some dispersion across individual respondents’ probabilities, the average survey-based probabilities were very close to their market-based counterparts.
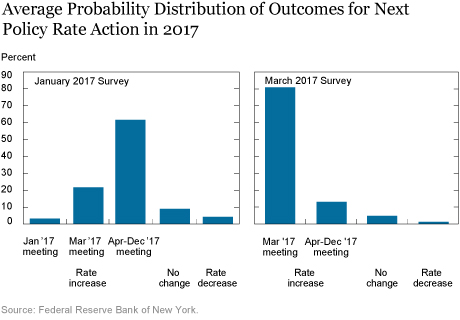
In addition to enabling a comparison with market-implied probabilities, the Desk surveys give us insight into individual respondents’ views on the distribution of outcomes for the timing of the FOMC’s next policy rate action. The chart below compares probability distributions calculated from two different sets of Desk surveys. The left panel shows the average probability assigned to various outcomes for the next policy rate action in advance of the January 2017 FOMC meeting. The right panel shows the average probability for the next policy rate action ahead of the March 2017 meeting. The former is more dispersed, with most of the probability assigned to a hike occurring sometime after the March FOMC meeting, whereas the latter shows the average probability distribution had shifted to assign most weight to a rate hike occurring at the March meeting.
Conclusion
Expectations for monetary policy have important implications for financial markets and the economy. Policy expectations extracted from federal funds futures contracts and the Desk’s Surveys of Primary Dealers and Market Participants provide valuable information relevant to gauging the probability financial market participants attach to policy rate increases at upcoming FOMC meetings. We examined what the market has viewed as the probability of an increase in the federal funds target range just before each of the rate increases during the current normalization cycle. Although the evolution of expectations for a policy rate increase varied substantially in the run-up to each rate increase, both market- and survey-based measures indicated a high probability for a rate hike in the days ahead of each FOMC meeting.
Disclaimer
The views expressed in this post are those of the authors and do not necessarily reflect the position of the Federal Reserve Bank of New York or the Federal Reserve System. Any errors or omissions are the responsibility of the authors.
 Ryan Bush is an associate in the Federal Reserve Bank of New York’s Markets Group.
 Marco Huwiler is a deputy director of the Swiss National Bank and currently seconded to the Bank’s Markets Group.
 Eric LeSueur is a manager in the Bank’s Markets Group.
 Giorgio Topa is a vice president in the Bank’s Research and Statistics Group.
How to cite this blog post:
Ryan Bush, Marco Huwiler, Eric LeSueur, and Giorgio Topa, “How Much Is Priced In? Market Expectations for FOMC Rate Hikes from Different Angles,” Federal Reserve Bank of New York Liberty Street Economics (blog), November 30, 2017, http://libertystreeteconomics.newyorkfed.org/2017/11/how-much-is-priced-in-market-expectations-for-fomc-rate-hikes-from-different-angles.html.


 RSS Feed
 Follow Liberty Street Economics