The Federal Reserve Bank of New York released results today from its October 2018 SCE Credit Access Survey, which provides information on consumers’ experiences with and expectations about credit demand and credit access. The survey is fielded every four months and was previously fielded in June.
The latest survey shows a decline in application rates for credit over the previous twelve months, and an increase in rejection rates in 2018, compared with 2017. Consistent with a decline in demand due to higher mortgage interest rates, the share of respondents who applied for a mortgage refinance during the past year was lower in 2018 than in 2017. Rejection rates reported during 2018 rose for credit card applications and credit card limit extension requests, and also increased notably for mortgage refinance applications.
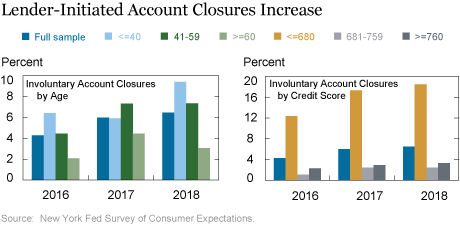
Another interesting development revealed by the survey is that, while there was no appreciable change in borrower-initiated account closings between 2017 and 2018, there was a sharp increase in the proportion of respondents who reported that a lender closed one of their accounts (most commonly a credit or store retail card) during the past twelve months. In October, 7.2 percent of those surveyed reported such a lender-initiated event, compared with 5.7 percent in October 2017 and 4.2 percent in October 2016. In fact, the 2018 figure is the highest rate reported since the start of our survey in 2013.
Looking ahead, the proportion of respondents who reported that they are somewhat or very likely to apply for credit over the next twelve months remained stable overall, with the exception of mortgage refinances for which fewer respondents expect to apply, when compared with expectations reported in 2017, and even more so compared with 2016. Survey participants also expressed more pessimism in 2018 about the chances of future credit card limit extension requests being accepted compared with 2017. Additional results from the survey are available in the press release.
The SCE Credit Access Survey, which has been fielded every four months since October 2013 as part of the broader Survey of Consumer Expectations (SCE), queries respondents’ experiences of and expectations for applying for and obtaining different types of credit. The data, together with a comprehensive set of interactive charts, are published every four months by the New York Fed’s Center for Microeconomic Data. As with other components of the SCE, we report statistics not only for the overall sample, but also by age and self-reported credit score. The underlying microdata (individual-level) for the full survey are made available with an eighteen-month lag.
In the remainder of this post, we dive into the recent developments surrounding credit cards and account closures. We first note that several of our latest findings match evidence from other data sources, such as the Federal Reserve Board’s Senior Loan Officer Opinion Survey (SLOOS), which captures conditions on credit demand and credit tightness from the perspective of bank loan officers. Respondents to the SLOOS have reported a weakening in credit card applications and a tightening in credit card limits and credit card standards during 2018 with successful applicants needing a higher credit score.
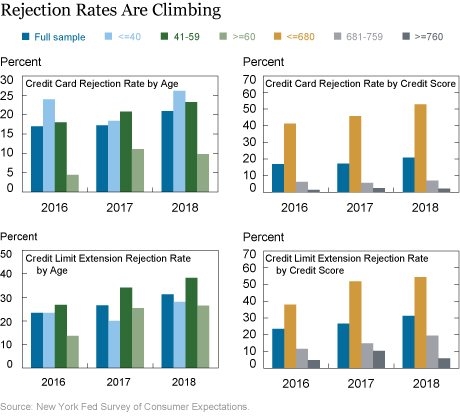
SCE Credit Access Survey data can be segmented by borrower age and credit score. This allows us to investigate whether credit tightening (from the credit seeker’s perspective) affected subgroups of applicants differently. Given the relatively low numbers of applicants in each triannual survey, for this analysis, we pool across the three surveys in each year. The charts below show shares among individuals who applied for a credit card or credit limit extension over the past twelve months, but whose application was rejected, in each year from 2016 to 2018 by age and credit score. Note that given the one-year look-back in the question wording, 2018 responses reflect experiences in 2018 and in part of 2017. For both types of applications, we see increases in the rejection rates between 2016 and 2018 across all age and credit score groups, but particularly large increases for those with the lowest credit scores (under 680).

Our latest findings on account closings are also consistent with results reported in the New York Fed’s Quarterly Report on Household Debt and Credit, which measures credit originations, balances, and delinquencies as reported on Equifax consumer credit reports. The latest report shows an increase over the past year and a half in the number of account closings reported on credit reports, with these accounts primarily being credit cards. As we do not observe the reason for account closings in our credit report data, our expectations survey can provide additional insight into this recent development. First, as mentioned earlier, we find that the increase is driven by lender-initiated closings as opposed to borrower-initiated closings for which we see no meaningful increase. Second, we can investigate whose accounts were closed, distinguishing by the borrower’s age and credit score. The chart below shows broad increases in lender-initiated account closings since 2016 across all age and credit score groups, with especially large increases for those under age 60 and for lower-credit-score (up to 680) account holders.

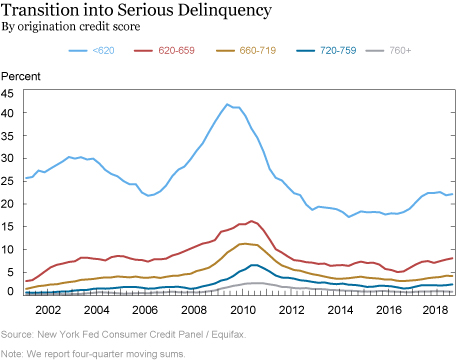
What should we make of the recent tightening in credit card and credit limit extension applications and the recent increase in account closings? The tightening in standards for credit card issuance over the past two years followed a period of steady growth in credit card issuance and in aggregate credit limits since 2013, including growth in nonprime issuance. A previous Liberty Street Economics blog post that discussed this trend reported a noticeable increase in credit card delinquency rates that started at the end of 2016. The chart below presents an update, showing credit card transition rates into serious delinquency, defined as the balances that have gone from current or early delinquency into ninety or more days late, as a percentage of the balance from the previous quarter that was less than ninety days past due. Unlike in the previous charts, credit scores in the delinquency chart are measured at credit card origination. The sharpest increases in delinquency rates were among those with low credit scores at origination, though there were also small increases in delinquencies for prime borrowers. The steep worsening among the lowest-score borrowers has moderated in 2018, although the flows into delinquency have increased during 2018 for the groups represented by the red and gold lines. A recent blog post describing borrowing and repayment outcomes by age showed that delinquency rates increased for all age groups, but are highest among younger borrowers.

Particularly in the context of a strong economy and still relatively low, though rising, interest rates, the elevated flow into serious delinquency is potentially concerning. Evidence from the SCE Credit Access Survey, SLOOS, and our Quarterly Report on Household Debt and Credit suggests that looser credit standards and an increase in subprime card issuance during the 2013-16 period are likely to have contributed to the rise in delinquency rates. However, the increase in the delinquency rate can be seen even within finer credit score buckets, which is consistent with a loosening in underwriting standards beyond just credit scores with more cards going to more marginal applicants.
Alternatively, the increase in the credit card delinquency rate may reflect the gradual rise in interest rates or weakening economic conditions facing subgroups of borrowers, even while the economy overall is doing well. Going forward, we plan to continue investigating these issues and to provide additional unique insights from our SCE Credit Access Survey as well as our consumer credit report data.
Disclaimer
The views expressed in this post are those of the authors and do not necessarily reflect the position of the Federal Reserve Bank of New York or the Federal Reserve System. Any errors or omissions are the responsibility of the authors.

Olivier Armantier is an assistant vice president in the Federal Reserve Bank of New York’s Research and Statistics Group.

Joelle Scally is a senior data strategist in the Bank’s Research and Statistics Group.
 Kyle Smith is a senior research analyst in the Bank’s Research and Statistics Group.
 Wilbert van der Klaauw is a senior vice president in the Bank’s Research and Statistics Group.
How to cite this blog post:
Olivier Armantier, Joelle Scally, Kyle Smith, and Wilbert van der Klaauw, “Just Released: A Closer Look at Recent Tightening in Consumer Credit,” Federal Reserve Bank of New York Liberty Street Economics (blog), December 3, 2018, https://libertystreeteconomics.newyorkfed.org/2018/12/just-released-a-closer-look-at-recent-tightening-in-consumer-credit.html.


 RSS Feed
 Follow Liberty Street Economics
In reply to CL Jones: Thank you for your comment, and we are very sorry to hear of the troubles you have experienced recently. Our intention in this article was to be purely descriptive rather than to judge. As microeconomists, our research strives to highlight and understand variation and inequality in experiences and outcomes, so it helps us when we hear experiences and insights from people like you.
As a disabled consumer living in Alaska, with high utility cost and unemployment, I had to make choices between credit card payment to AMX and mortgage hence choosing to pay mortgage with Interest at 3.75% where AMX refused to lower interest and retains at 29% with 35 monthly late fees, on business loss that failed during the past year. News and Fed choose to call cc holders greedy, spending on lavish gifts, without knowing the entire story. Our utility cost more than doubled in 2018, however income declined with lower spending from consumers. Next CRA’s continue to profit at consumer expense with their credit scoring, and black mark system, again without knowing why. So unless they walk a mike in our shoes please do not criticize. Not everyone has six figure income.