In our previous post, we assessed losses to customers and clients from foregone opportunities after Lehman Brothers filed for bankruptcy in September 2008. In this post, we examine losses to Lehman and its investors in anticipation of bankruptcy. For example, if bankruptcy is expected, Lehman’s earnings may decline as customers close their accounts or certain securities (such as derivatives) to which Lehman is a counterparty may lose value. We estimate these losses by analyzing Lehman’s earnings and stock, bond, and credit default swap (CDS) prices.
Lehman’s Earnings Shortfall
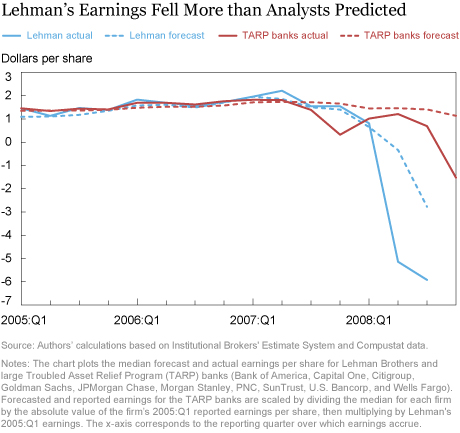
Altman defines the indirect costs of bankruptcy as the lost sales and profits from customers avoiding a distressed firm—as happened for Lehman—and higher financing costs from creditors and suppliers. He measures these costs by the difference between expected and actual profits in the years leading up to bankruptcy. We follow a similar procedure for Lehman and show, in the chart below, Lehman’s actual (solid blue line) and expected (dashed blue line) earnings per share (EPS) starting in 2005. The expected EPS is measured by the median of analyst forecasts made in the prior quarter.

Lehman reported record earnings for the second quarter of 2007, after which EPS consistently declined. Analyst forecasts tracked Lehman’s reported earnings closely through 2007. In 2008, Lehman’s outlook worsened considerably as its reported EPS dropped sharply in early 2008 and turned negative thereafter. However, analysts remained sanguine about its prospects. While their forecasts also turned negative in the second quarter of 2008 (ending May 31), they were too optimistic by a wide margin. Over the second and third quarters of 2008, Lehman’s earnings fell short of expectations by about $4.4 billion, or about 1.5 percent of its pre-bankruptcy value of total assets (debt plus equity).
Declines in pre-bankruptcy profits may be due to the poor economic conditions at the time rather than the onset of bankruptcy. Indeed, other large firms—such as recipients of Troubled Asset Relief Program (TARP) funding—also experienced lower earnings (see the chart above). In the second and third quarters of 2008, average TARP bank earnings were lower than analyst estimates by 0.2 percent of their average asset values. Thus, relative to other large banks, Lehman’s earnings shortfall was about 1.3 percent of its pre-bankruptcy assets.
We also compare Lehman’s earnings to the broader market in the second and third quarters of 2008. Firms in the Dow Jones Industrial Average undershot analyst estimates by about 0.8 percent of their average asset value, implying that Lehman’s indirect costs due to looming bankruptcy were about 0.7 percent of assets.
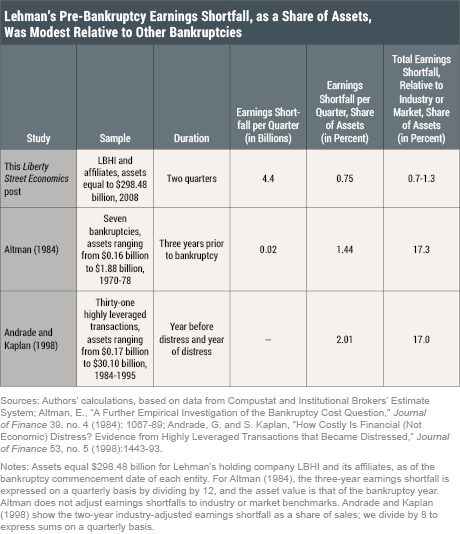
On a per quarter basis, Lehman’s indirect costs were in line with those of prior studies, which range from about 1.5 to 2.0 percent of assets (see the table below). However, the duration of earnings shortfall was longer in other studies—about two to three years—so that the total industry-adjusted shortfall was about 17 percent of assets. It may be that Lehman’s bankruptcy was not expected until shortly before its filing, mitigating the indirect costs of its bankruptcy.

Lehman’s Stock, Bond, and CDS Prices
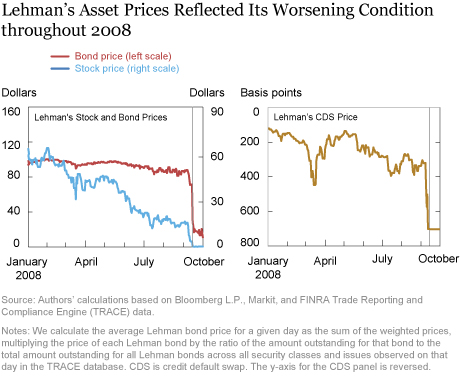
In addition to earnings, expectations about Lehman’s prospects may be viewed through its stock, bond, and CDS prices. After reaching an all-time high in January 2008, Lehman’s stock price (the left panel of the chart below) started a gradual decline that intensified in late May and June around its 2008:Q2 earnings release. Nonetheless, Lehman shares still traded above $7 on September 10 when it pre-announced its disastrous third-quarter earnings, before collapsing to $0.21 on September 15.
Lehman’s bond prices (the left panel of the chart below) followed a similar but more muted decline, trading at nearly $77 on September 10, on average, before crashing to $28 on September 15. Since the face value of its bonds was $100, the bond prices implied an expected present value of recovery of just 28 percent, close to the present value of their actual recovery (see this post for more details).
To what extent are the stock and bond price movements specifically related to Lehman’s default? Lehman’s CDS prices (the right panel of the chart below, with the y-axis reversed), which increase with the probability of its default, rose gradually in 2008 to 320 basis points on September 8 and then jumped to 702 basis points on September 12, indicating that the cost of insuring against Lehman’s default had increased by about $400,000 per $10 million of value.

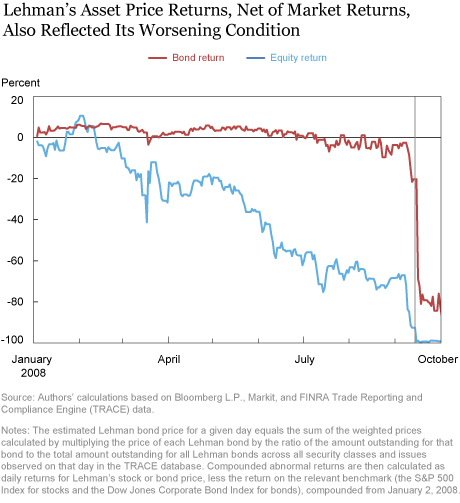
We account for changes in Lehman’s security prices owing to prevailing market conditions by subtracting the relevant market returns (using S&P 500 Index returns for stocks and Dow Jones Corporate Bond Index returns for bonds) from Lehman’s security returns. In the chart below, we plot the compounded abnormal returns from the start of 2008 for Lehman’s equity and bonds. On September 7, 2008, one week before bankruptcy, equity returns were about -67 percent and bond returns were roughly -3 percent. As with earnings, the evolution of asset prices suggest that investors were caught by surprise by Lehman’s bankruptcy.

The evolution of Lehman’s equity market value prior to bankruptcy provides another estimate (in addition to earnings shortfalls) of the indirect cost of its bankruptcy. In Lehman’s second and third fiscal quarters of 2008 (that is, March 1–August 31, 2008), its compounded abnormal equity returns were about -68 percent. Applying these returns to Lehman’s equity market value on February 29, 2008, the loss in value was $19 billion, or about 6.5 percent of the pre-bankruptcy value of Lehman’s assets. By comparison, Cutler and Summers estimate a loss in equity market value for Texaco of about $1 billion, or 9.5 percent of pre-distress asset value, when it filed for bankruptcy in 1987. While Lehman’s loss in equity market value was about ten times that of Texaco, the bank was far larger than Texaco in terms of total assets, resulting in a smaller loss relative to assets.
A general concern is that these estimates, based on pre-bankruptcy asset price declines, may overestimate the indirect costs of bankruptcy. This is because asset price losses may in part be attributed to the firm’s economic distress and not the advent of bankruptcy per se. Controlling for market-wide or industry performance mitigates this concern, but does not eliminate it. Further, some of the distressed firm’s losses may benefit other firms, resulting in a value transfer rather than a value loss to society.
Disclaimer
The views expressed in this post are those of the authors and do not necessarily reflect the position of the Federal Reserve Bank of New York or the Federal Reserve System. Any errors or omissions are the responsibility of the authors.

Erin Denison is a senior research analyst in the Federal Reserve Bank of New York’s Research and Statistics Group.

Michael J. Fleming is a vice president in the Bank’s Research and Statistics Group.

Asani Sarkar is an assistant vice president in the Bank’s Research and Statistics Group.
How to cite this blog post:
Erin Denison, Michael J. Fleming, and Asani Sarkar, “The Indirect Costs of Lehman’s Bankruptcy,” Federal Reserve Bank of New York Liberty Street Economics (blog), January 17, 2019, https://libertystreeteconomics.newyorkfed.org/2019/01/the-indirect-costs-of-lehmans-bankruptcy.html.


 RSS Feed
 Follow Liberty Street Economics