In a recent post, we documented the transmission of monetary policy through money market funds (MMFs). In this post, we complement that analysis by comparing the transmission of monetary policy via MMFs to the transmission via bank deposits and studying the impact of the differential pass-through on the size of the MMF industry. To this purpose, we focus on rates on certificates of deposit (CDs) offered to banks’ retail customers and compare their response to monetary policy with that of retail MMF yields.
Differential Pass-through across Bank CDs and MMFs
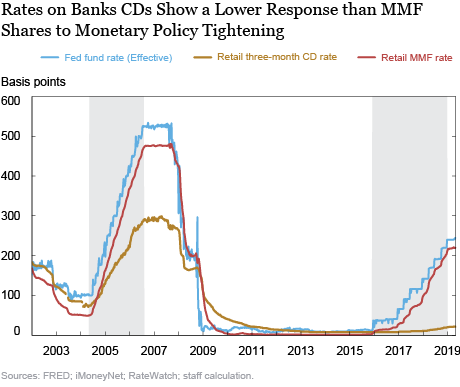
The chart below shows the time series of three-month CD rates, MMF net yields, and the effective federal funds rate. Although both CD rates and MMF yields track the federal funds rate, their response to monetary policy changes is starkly different and has become even more so during the last tightening cycle.

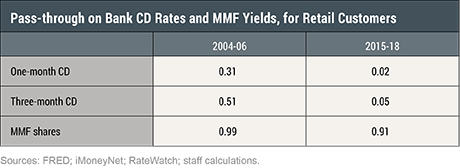
Between May 2004 and July 2006, the effective fed funds rate increased from 100 to 525 basis points (bps). During the same period, the net yield of retail MMFs increased by roughly the same amount, from 0.5 percent in May 2004 to 5 percent in July 2006. As the table below shows, this corresponds to a pass-through of 99 percent. In contrast, over the same period, rates on three-month retail CDs increased only by half as much, reaching 3 percent in July 2006—a pass-through of only 50 percent. The pass-through on one-month CD rates was even lower, just 30 percent; indeed, the one-month CD rate was short of 200 bps by the end of the tightening cycle.

After a long period with policy rates at the zero lower bound, the Federal Reserve started a new tightening cycle in December 2015, which continued until December 2018. Over this period, the effective federal funds rate increased by more than 200 bps. Over the same period, the net yield of retail MMFs increased by roughly the same amount, with a pass-through of 91 percent, confirming the very high elasticity (or beta) to rate hikes observed in the early 2000s. In contrast, rates on retail CDs barely moved. The rate on three-month CDs remained below 10 bps until July 2017, and only increased to 20 bps by the end of the tightening cycle, a pass-through of only 5 percent; the pass-through to the one-month CD rate was similarly low, at only 2 percent.
The Expansion of the MMF Industry during Monetary Policy Tightening
Given the lower responsiveness of bank CDs to monetary policy tightening, one could expect that, during a tightening cycle, money flows from CDs to MMFs.
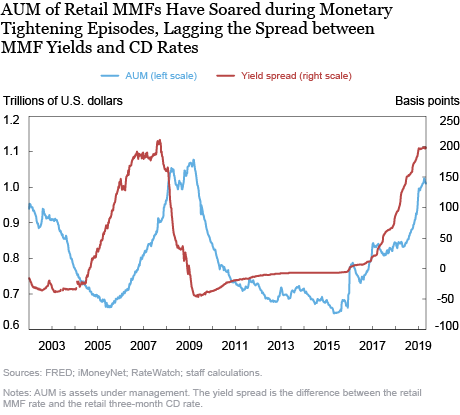
Indeed, as the chart below shows, the size of the MMF industry increased during both tightening episodes, lagging the increase in the spread between retail MMF yields and CD rates by roughly a year. From May 2004 until July 2006, the assets under management (AUM) of retail MMFs increased by 5 percent, followed by a further increase of 16 percent over the next year.
Consistent with the fact that rates on bank deposits have become stickier, during the last tightening cycle, the MMF industry increased even more dramatically. AUM of retail MMFs increased from $700 billion in December 2015 to almost $1 trillion in December 2018, a 37 percent hike, and kept increasing during the first half of 2019.

Is the Lower Beta on Deposits due to the 2014 MMF Reform?
A possible explanation for the lower elasticity of bank CD rates during the last tightening cycle is the effect of the 2014 MMF reform by the Securities and Exchange Commission, which went into effect in October 2016. By stripping prime MMFs of some of their liquidity features, the reform has made such investment vehicles a less attractive option for cash investors.
The sharp increase in the size of the MMF industry over the last three years belies such an explanation. If anything, as described above, the AUM of retail MMFs have increased even more sharply than in the early 2000s. Indeed, as documented by Cipriani and La Spada (2018), although prime MMFs have become a less attractive liquidity vehicle and have shrunk as a result of the reform, investors have shifted to government MMFs, which were not affected by the amended rules. Moreover, as shown in a previous post on Liberty Street Economics, within the MMF industry, government and prime MMF exhibit a similar monetary policy pass-through. Therefore, the intra-industry shift from prime to government MMFs should not have made easier for banks to leave their CD rates low.
Summing Up
The elasticity of bank CD rates to monetary policy tightening is much lower than that of MMF shares and has become ever lower after the financial crisis. The weaker elasticity of CD rates relative to MMF shares is accompanied by an expansion of the size of the MMF industry during tightening cycles. Such expansion was more pronounced for the last tightening cycle than during the previous one. This evidence casts doubt on the view that the MMF reform is a reason why the beta on CD rates has become so negligible.
 Marco Cipriani is an assistant vice president in the Federal Reserve Bank of New York’s Research and Statistics Group.
Jeff Gortmaker is a former senior research analyst in the Bank’s Research and Statistics Group.
 Gabriele La Spada is an economist in the Bank’s Research and Statistics Group.
How to cite this post:
Marco Cipriani, Jeff Gortmaker, and Gabriele La Spada, “Monetary Policy Transmission and the Size of the Money Market Fund Industry,” Federal Reserve Bank of New York Liberty Street Economics, November 20, 2019, https://libertystreeteconomics.newyorkfed.org/2019/11/monetary-policy-transmission-and-the-size-of-the-money-market-fund-industry.html.
Disclaimer
The views expressed in this post are those of the authors and do not necessarily reflect the position of the Federal Reserve Bank of New York or the Federal Reserve System. Any errors or omissions are the responsibility of the authors.


 RSS Feed
 Follow Liberty Street Economics
“The weaker elasticity of CD rates relative to MMF shares” is a good thing. Otherwise money velocity would decline even further. Banks don’t loan out deposits. Banks create deposits when they lend/invest. So all bank-held savings are un-used and un-spent, lost to both consumption and investment, indeed to any type of payment or expenditure. The only way to activate these funds is for their owners to invest/spend either directly or indirectly outside of the payment’s System. Savers never transfer their savings outside of the payment’s System (where all monetary savings originate) unless they hoard currency, or convert to other National currencies. The principle ways in which to reduce the volume of bank deposits is for the saver-holder to use his funds for the payment of a bank loan, interest on a bank loan for the payment of a banks service, or for the purchase from their banks of any type of commercial bank security obligation, e.g., bank stocks, debentures, etc. This is the sole source of secular strangulation since 1981 (the apex in the monetization of time deposits – the near end of gate-keeping restrictions), not robotics, not demographics, not globalization. See the GOSPEL: “Should Commercial Banks Accept Savings Deposits?” Conference on Savings and Residential Financing 1961 Proceedings, United States Savings and loan league, Chicago, 1961, 42, 43.
Perhaps people assign a higher value post-crisis to the “embedded option” in CDs (i.e. FDIC insurance) which does not exist in MMFs. This could explain, in part, why CD rates have not increased commensurately. Thoughts?
Hi. Thanks for the interesting post. Wouldn’t it make sense to rebase the AUM to say US Nominal GDP? Given the economy has grown from say $15tn in 2008 to $21tn now, this makes quite a difference. The impact of US Treasury issuance and stocks market cap could also be impacting a lot. Regards
Thanks for posting this piece. It’s very interesting. I have 2 questions: 1). Any explanation for why the deposit beta is so low? 2). Why do you think banks can keep the deposit beta so low without losing customers and deposits?