The COVID-19 pandemic has put significant pressure on debt markets, especially those populated by riskier borrowers. The leveraged loan market, in particular, came under remarkable stress during the month of March. Bank-loan mutual funds, among the main holders of leveraged loans, suffered massive outflows that were reminiscent of the outflows they experienced during the 2008 crisis. In this post, we show that the flow sensitivity of the loan-fund industry to the COVID-19 crisis (and to negative shocks more generally) seems to be even greater than that of high-yield bond funds, which also invest in high-risk debt securities and have received much attention because of their possible exposure to run-like behavior by investors and their implications for financial stability.
Loan Funds and the Leveraged Loan Market
Leveraged loans, at approximately $1.2 trillion outstanding as of the end of 2019, represent a significant share of total corporate lending in the United States. This market was disrupted in March 2020 as industry indexes plummeted, and several investors in the market experienced severe, negative liquidity shocks. Bank-loan funds are registered investment vehicles that invest primarily in corporate leveraged loans; they have grown at a fast rate since 2010, reaching a peak of about $216 billion at the end of 2018. Among such investment vehicles, open-end mutual funds represent the lion’s share (the other two categories being closed-end funds and exchange-traded funds, or ETFs) and are the focus of this post. A key feature of open-end loan funds, which distinguishes them from other important classes of leveraged-loan investors, such as collateralized loan obligations (CLO), is that they engage in liquidity transformation. Leveraged loans are illiquid assets, but loan funds offer investors the opportunity to redeem their shares at will. This liquidity transformation exposes loan funds to run risk, particularly in periods of stress. The illiquidity of loan-fund portfolios has actually increased in recent years.
The Effects of the COVID-19 Pandemic
Over the first three weeks of March, as the COVID-19 crisis took hold, leveraged loan bid prices dropped precipitously. As the charts below show, the S&P/LSTA U.S. Leveraged Loan 100 Index dropped roughly 20 percent from March 1 to March 23.
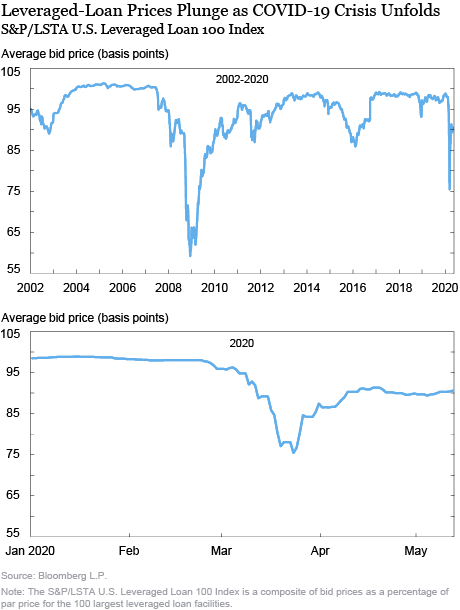
Over the same period, loan funds suffered heavy redemption pressure; as the next chart shows, from March 1 to March 23, loan funds experienced outflows amounting to roughly 11 percent of their initial assets under management (AUM).
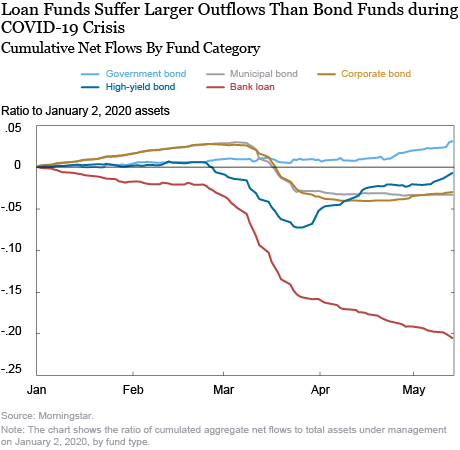
This drop is large, both by the historical standards of the loan-fund industry (for example, during the global financial crisis, from August to September 2008, loan funds suffered outflows of roughly 4 percent) and when compared to the flows experienced by other types of mutual funds that invest in debt securities and that have been negatively impacted by the COVID-19 crisis. For example, in the same chart, we show that, from March 1 to March 23, taxable corporate bond funds only experienced outflows equal to roughly 4 percent of their size. Even high-yield bond funds, which also hold some leveraged loans and invest in other debt securities with similar credit ratings (mainly BB, B, and CCC), had smaller outflows (6 percent) than loan funds.
Moreover, outflows from loan funds are not only much larger at any point in time, but they also last longer. Net flows in high-yield funds start reversing around March 26, possibly due to the several facilities that the Federal Reserve put in place in the second half of March to ease stress in financial markets; as of May 14, the cumulative net flows in high-yield funds since January are close to zero. In contrast, the outflows from loan funds, while also slowing down around March 26, have not stopped yet; as of May 14, the loan-fund industry has experienced outflows for a total of 21 percent of its AUM in early January.
Fund Returns and Investor Flows
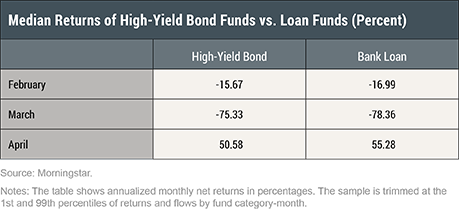
The larger and more persistent outflows from loan funds versus high-yield bond funds do not seem to be driven by a significant difference in the average performance of the two mutual-fund industries. In principle, it could be that loan funds have experienced larger outflows than high-yield funds because, in aggregate, they performed worse at the onset of the crisis. However, this is not really the case; in February and March, loan funds offered their investors similar returns to those offered by high-yield funds. As the table below shows, in February, the median annualized return of loan funds was -17 percent and that of high-yield bond funds was -16 percent. In April, the median loan fund actually performed better than the median high-yield bond fund.
What could explain the more marked pattern of outflows for loan funds? One possible explanation is that, at every point in time, loan-fund returns seem to be much less dispersed than those of high-yield funds. When returns are sufficiently heterogeneous across funds of the same category, investors try to use them to discriminate between skilled and unskilled managers, leaving funds with lower returns for those with better performance. As a result, even in bad times, part of investor flows could occur within the industry, and aggregate flows would exhibit relatively milder swings. In contrast, if fund returns are very compressed, it becomes harder for investors to distinguish among funds, and this can lead investors to flee the industry en masse in bad times, as uncertainty about economic conditions mounts. As the chart below shows, the dispersion of returns in the cross section of loan funds has been below that of high-yield funds almost every month since 2007, and the first months of 2020 were no exception. In contrast, the average returns in the two industries have been fairly similar over the last ten years.
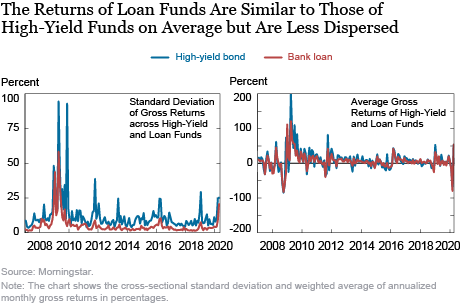
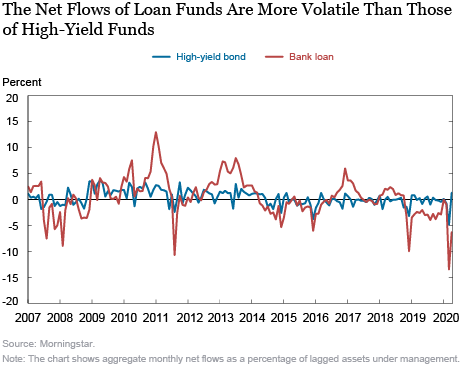
This difference in the return distribution of these two types of mutual funds, which invest in debt securities with similar credit-risk and maturity profiles, may explain why aggregate flows in loan funds tend to be more volatile over time than those in high-yield funds, as the chart below shows.
Summing Up
The loan-fund industry’s greater vulnerability to negative aggregate shocks may be explained by the fact that returns across loan funds tend to be more correlated than those across high-yield funds; as a result, investors may have a stronger incentive to leave the industry en masse in bad times, rather than reallocating their cash across funds within the industry. Amid heightened uncertainty surrounding the COVID-19 crisis, recent outflows from bond mutual funds, and especially high-yield funds, have raised concerns about potential fire sales by fund managers. Loan-fund outflows have been much larger and more persistent, thus warranting continuing analysis going forward.

Nicola Cetorelli is a vice president in the Federal Reserve Bank of New York’s Research and Statistics Group.
![]() Gabriele La Spada is a senior economist in the Bank’s Research and Statistics Group.
Gabriele La Spada is a senior economist in the Bank’s Research and Statistics Group.

João Santos is a senior vice president in the Bank’s Research and Statistics Group.
How to cite this post:
Nicola Cetorelli, Gabriele La Spada, and João Santos, “Outflows from Bank-Loan Funds during COVID-19,” Federal Reserve Bank of New York Liberty Street Economics, June 16, 2020, https://libertystreeteconomics.newyorkfed.org/2020/06/outflows-from-bank-loan-funds-during-covid-19.html.
Disclaimer
The views expressed in this post are those of the authors and do not necessarily reflect the position of the Federal Reserve Bank of New York or the Federal Reserve System. Any errors or omissions are the responsibility of the authors.


 RSS Feed
 Follow Liberty Street Economics
Good Topic and article. Deflation has taken hold in Europe and now taking hold in the US and other Global markets. With Deflation we will see Debt Deflation, which will lead to severe losses in Debt, mainly in High Yield, Junk, Real Estate, Leveraged Loan and etc., simply fire sales to worthless Debt. Illiquid MKTS and Funds closing.
Is it not possible that the greater observed sensitivity of bank loan fund flows relative to high yield bond fund flows is primarily related to the relative size of the two asset classes and mutual fund universe? With many more high yield bond funds (and high yield bond assets), the probability of the same percentage of outflows in response to a given shock is likely lower all else equal. In addition to the mathematical underpinning (more observations = less volatility) of the relative flow sensitivity observed over any given period, I would also look at the investor base for the two asset classes. Dispersion of performance may be part of the story, but the reality is likely that high yield bonds (and HY funds), as a much bigger part of the investment universe relative to bank loans, have a higher percentage of long-term allocations than bank loan funds.