The COVID-19 pandemic elevated financial market illiquidity and volatility, especially in March 2020. The mortgage-backed securities (MBS) market, which plays a critical role in the housing market by funding the vast majority of U.S. residential mortgages, also suffered a period of dysfunction. In this post, we study a particular aspect of MBS market disruptions by showing how a long-standing relationship between cash and forward markets broke down, in spite of MBS dealers increasing the provision of liquidity. (See our related staff report for greater detail.) We also highlight an innovative response by the Federal Reserve that seemed to have helped to normalize market functioning.
The Parallel Trading of Agency MBS
Most agency MBS are issued as securities in which interest (subtracting the credit guarantee and mortgage service fees) and principal payments on the underlying mortgages pass through pro rata to MBS investors. All agency MBS are effectively default-free with credit guarantees provided by Fannie Mae (FNMA), Freddie Mac, or Ginnie Mae. They are, however, subject to uncertainty as to the timing of cash flows, known as prepayment risk. There is substantial heterogeneity in prepayment risk across individual MBS because of the vastly different characteristics of the mortgage loans and borrowers behind the MBS.
Related to this heterogeneity in the risks of different mortgage pools, the agency MBS market has a unique organization that utilizes two parallel trading mechanisms. One is the specified pool (SP) market in which individual MBS are traded using specific contracts while the other is the to-be-announced (TBA) market in which similar MBS are traded together using standardized contracts. A seller with TBA-eligible MBS can freely choose to sell through either the SP or the TBA market.
The parallel market structure gives rise to three major differences in the characteristics of the SP and TBA contracts. First, a single price is set for a TBA contract that accepts any MBS satisfying certain eligibility requirements—for example, the delivered MBS is guaranteed by Fannie Mae or Freddie Mac, contains thirty-year fixed-rate mortgages, and pays a coupon of 4 percent. In consequence, sellers have incentives to deliver the cheapest eligible MBS, and buyers pay a cheapest-to-deliver (CTD) price. This CTD discount is absent for SP contracts since they are priced individually. Second, SP trading incurs higher transaction costs than TBA trading, with the difference being about 30-60 basis points on average. Third, TBA trading occurs through a forward contract that settles once every month, while the SP trading is through a spot contract that often settles close to TBA settlement days. Hence, a seller can collect cash sooner through SP trading.
SP Payup before and during the COVID-19 Market Disruptions
In this Liberty Street Economics post, we use “payup” to denote the weighted-average SP minus the weighted-average TBA price on a particular day. The prices of SP contracts are typically higher than those of TBA contracts. In particular, higher-quality MBS (that is, those with lower prepayment risk) tend to be sold in SP markets where the CTD discount is absent, whereas lower-quality MBS are generally sold in TBA markets to take advantage of lower trading costs. The chart below shows that, before the COVID-19 crisis, the price of the FNMA thirty-year MBS contract with a 3.5 percent coupon, one of the most liquid agency-coupon combinations, was typically higher in the SP market than in the TBA market.
We note that market practitioners may use the term “payup” differently. For example, practitioners may use an adjusted measure of the SP‑to‑TBA price difference to account for a variety of factors such as the different settlement dates of the SP and TBA contracts or the loan balances of the underlying mortgages.
Amid the market turmoil in March, the SP payup diminished substantially. Specifically, as shown in the chart above, since March 9 when stock market trading was halted due to extreme volatility, the payup, as defined above, totally disappeared and, strikingly, even turned into a discount, according to our methodology. The payup reappeared only after the Fed’s aggressive actions on March 23 “to increase the System Open Market Account holdings of Treasury securities and agency … MBS in the amounts needed to support the smooth functioning of markets for Treasury securities and agency MBS.” Yet, even today, the payup continues to be lower than before the COVID-19 pandemic.
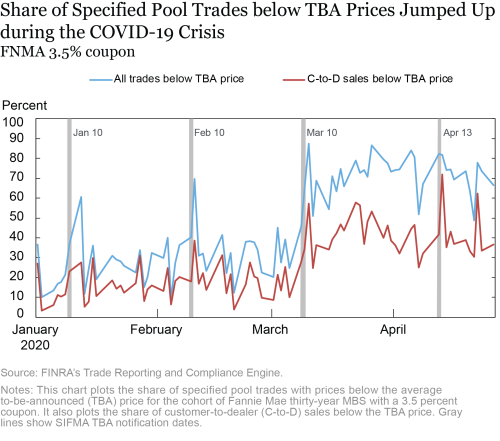
In addition to the diminished payup, the number of trades in the SP market with prices below TBA prices increased markedly in March 2020. Since mid-March, around 75 percent of SP trades have been below the daily average TBA prices for the FNMA thirty-year 3.5 percent coupon cohort (see chart below). In contrast, the share of SP trades below the average TBA price was typically less than 40 percent in January 2020, according to our methodology. Thus, normal price relations in the MBS market were distorted during the pandemic crisis.

Diminished SP Payup, Cash-Forward Arbitrage, and Dealers’ Liquidity Provision
The liquidity shock in the MBS markets caused customers to quickly liquidate their holdings for cash rather than wait for up to thirty days in the TBA market. For example, a TBA trade on March 16 would be settled on April 15. Thus, sellers could not liquidate (that is, receive cash from the sale) before April 15, creating a disincentive to sell in the TBA market. Instead, sellers turned to the SP market to raise cash, pushing down SP prices relative to TBA prices.
The diminished SP payup—especially when it turned into an SP discount— indicates market price dislocations. In our paper, we show that this reversal from an SP payup to an SP discount is robust to accounting for changing characteristics of bonds traded in the SP market. This implies that, relative to the pre-COVID period, MBS with similar fundamental values were traded at a lower price in the SP market than the TBA market. Dealers could potentially buy the MBS in the SP market and simultaneously sell a TBA contract. Provided the cost of funding this strategy was below its returns, dealers could reap a positive expected profit at the TBA settlement. This strategy is known as cash-forward arbitrage in practice, similar to the cash-futures arbitrage in the Treasury market.
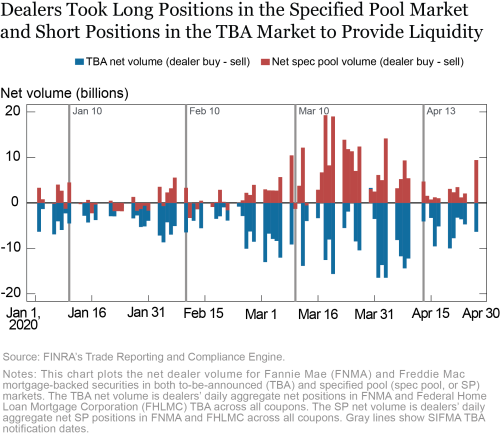
As important intermediaries in the MBS market, broker-dealers are the natural liquidity providers and arbitrageurs. Indeed, as the next chart shows, dealers were on net buying from customers in the SP market and selling to customers in the TBA market and, in so doing, provide liquidity to the market. This participation stands in contrast to the 2013 fixed‑income sell-off , when dealers reduced their net positions in agency MBS. However, the continuing reduction in the payup implies that dealers’ cost of deploying capital was too high to restore the payup to its pre-pandemic levels immediately.

The Fed’s Innovative Response to MBS Market Disruptions
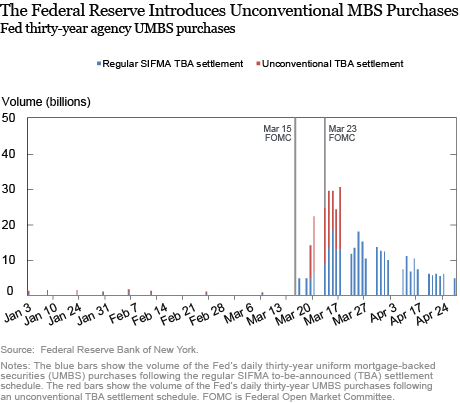
To ensure a properly functioning secondary MBS market, the Federal Open Market Committee announced an increase in agency MBS holdings by at least $200 billion on March 15 and further purchases of agency MBS on March 23. The next chart shows how the Fed boosted purchases of uniform MBS since March 16. A unique feature of the Fed’s recent MBS purchases is that, from March 19 to March 27, most of the transactions followed an unconventional TBA settlement date that allowed primary dealers to receive the sales proceedings within two to three trading days, much sooner than the nearest SIFMA settlement date of April 15. These unconventional TBA trades reduced the short-term selling pressure on the TBA market, so that after April 1, the pre-pandemic SP payup started to emerge again. This resumption of more normal MBS market pricing suggests that the Fed’s unconventional TBA trades provided the “fast‑moving capital” that the market needed.

Summing Up
We describe a breakdown in normal relations between spot and forward MBS markets during the pandemic. The market failure occurred in spite of continued liquidity provision by primary dealers, which speaks to the magnitude of forced selling that occurred during this stressful period in the markets. The return of the typical payup between cash and forward MBS markets after the Fed started purchasing agency MBS suggests that the Fed’s actions, and its use of an unconventional TBA settlement procedure in particular, were effective at restoring market conditions to a more normal state.
Jiakai Chen is an assistant professor at the Shidler College of Business, University of Hawaii.

Haoyang Liu is an economist in the Federal Reserve Bank of New York’s Research and Statistics Group.

David Rubio is a senior research analyst in the Bank’s Research and Statistics Group.

Asani Sarkar is an assistant vice president in the Bank’s Research and Statistics Group.
Zhaogang Song is an associate professor at the Johns Hopkins Carey Business School.
Related Reading:
Chen, J., H. Liu, A. Sarkar, and Z. Song. 2020. “Cash-Forward Arbitrage and Dealer Capital in MBS Markets: COVID-19 and Beyond,” Federal Reserve Bank of New York Staff Reports, no. 933 July.
How to cite this post:
Jiakai Chen, Haoyang Liu, David Rubio, Asani Sarkar, and Zhaogang Song, “MBS Market Dysfunctions in the Time of COVID-19,” Federal Reserve Bank of New York Liberty Street Economics, July 17, 2020, https://libertystreeteconomics.newyorkfed.org/2020/07/mbs-market-dysfunctions-in-the-time-of-covid-19.html.
Disclaimer
The views expressed in this post are those of the authors and do not necessarily reflect the position of the Federal Reserve Bank of New York or the Federal Reserve System. Any errors or omissions are the responsibility of the authors.


 RSS Feed
 Follow Liberty Street Economics
The Fed’s balance sheet has indeed grown significantly: it has increased by $ 2.8 trillion since the beginning of March and now stands at about $ 7 trillion, but the bulk of the increase came from Treasury bonds and mortgage-backed securities (MBS), which are also protected by government guarantees. At the same time, the total volume of risky non-financial debt, which the Fed was going to buy, turned out to be “tiny” on the Fed’s balance sheet, Cecchetti and Schonholz write: $ 39 billion as of July 1, or 1.4% of the balance increase since the beginning of March.
As you probably know the bulk of the selling came from mortgage reits, who used specified pools to control their convexity risk.