


A growing body of evidence points to large negative economic and health impacts of the COVID-19 pandemic on low-income, Black, and Hispanic Americans (see this LSE post and reports by Pew Research and Harvard). Beyond the consequences of school cancellations and lost social interactions, there exists considerable concern about the long-lasting effects of economic hardship on children. In this post, we assess the extent of the underlying economic and financial strain faced by households with children living at home, using newly collected data from the monthly Survey of Consumer Expectations (SCE).
We find evidence of disproportionate hardship: households with children have been more likely to suffer job and income losses, contributing to a greater need to dig into savings, a higher rate of missed rent and debt payments, and food insufficiency. We also observe a greater reliance on external support, including unemployment benefits, SNAP aid (food stamps), and financial support and food donations from friends, family, and food banks. Single-parent families, non-white households with children, and households with children residing in lower-income neighborhoods report particularly high levels of hardship and reliance on social networks and government support.
Recent data suggest that the CARES Act and other public and private interventions have been largely successful so far in preventing a wholesale surge in household loan delinquencies. This outcome has been achieved in large part by providing income support, and by allowing borrowers to defer payments through mortgage and student loan forbearance programs and through additional temporary relief provided by auto loan lenders and credit card servicers. Here, we present new evidence from the Survey of Consumer Expectations on the extent and distribution of economic distress. The SCE is a monthly internet-based survey produced by the Federal Reserve Bank of New York since June 2013. It is based on a twelve-month rotating panel of roughly 1,300 nationally representative U.S. household heads. As part of its May and June surveys, the SCE included a set of targeted questions to study how the COVID-19 pandemic has affected the public’s financial situation and expectations. In our analysis, we pool data from the two surveys, so the findings describe respondents’ experiences as reported during May and June.
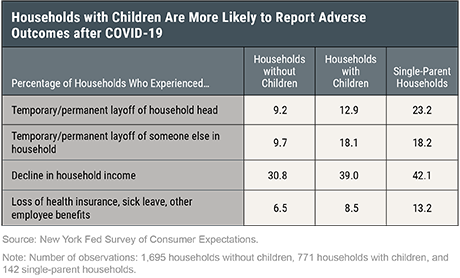
Results shown in the table below reveal several noteworthy differences in how households without children (left column) and with children (middle column) have been affected by the pandemic. (Households with children are defined here as the households of respondents with children under age 18 usually living with them in their primary residence.) First, household heads living with minor children are more likely to have experienced temporary or permanent layoffs, and they also are more likely to have another household member who experienced a temporary or permanent layoff since the start of the pandemic. Accordingly, a greater proportion of households with children report reductions in total household income (39.0 percent versus 30.8 percent). Households with children living at home also more frequently report losing health insurance, sick leave, or other employee benefits since the start of the pandemic. Some of these differences in part reflect a greater exposure to the labor market downturn, with household heads not living with children on average being older and less likely to have been working (and more likely to be retired) when the pandemic took hold in the United States in March.
The next table provides several insights into how households have responded to these shocks. First, comparing households with and without children, greater fractions of households with children said they have canceled or postponed a major purchase or a vacation, have postponed in-person healthcare visits to doctors or hospitals, have cut back spending overall, and have had to dig into savings and emergency accounts to cover expenses. Households with children living at home are also more likely to have fallen behind on rent, mortgage, auto loan, or student loan payments since the start of the pandemic. Accordingly, they report increased financial stress and a higher take-up of loan forbearance and relief options, and they assign a higher average likelihood of not making a minimum debt payment over the next three months (15.0 percent versus 9.5 percent).

Heads of households with children are also more likely to report having trouble finding enough food to eat or to have missed meals, with a larger proportion receiving food donations from family, friends, and food banks since February. Other indicators suggest an increased reliance on external support more generally, with households with children more likely than those without to have received financial support from friends or family, to be receiving aid through SNAP, and to have applied for or be newly receiving unemployment benefits since February.
We find economic hardship to be considerably higher among single-parent households, 71.8 percent of which are headed by a female and 64.7 percent headed by someone who is non-Hispanic white. With the exception of similar or somewhat lower proportions of lone-parent households canceling or postponing a major purchase and canceling a summer vacation, trips, or summer camp (likely reflecting a lower baseline rate before the onset of the pandemic), the figures in the right column of the tables above show much higher rates of household-head job loss, income declines, and the need to dip into savings and emergency accounts. Furthermore, despite the absence of a partner/spouse, 18.2 percent of single-parent household heads report job loss by another adult (most frequently a co-resident adult child or parent). The tables also show single parents’ amplified dependence on financial and food support from friends, family, and food banks. Similarly, a large share of single- parent households have received or sought aid through SNAP (34.1 percent versus 13.1 percent for households with children overall) and unemployment benefits (24.5 percent versus 18.4 percent). Despite this support, 11.5 percent of single parents report having trouble finding enough food to eat or kids missing meals. In addition, single parents report a considerably higher average perceived likelihood of 21.6 percent (versus 15.0 percent for households with children overall) of not making a minimum debt payment over the next three months, signaling the financial distress they are in.
Finally, we investigate where we see the greatest hardship among households with children, as captured by food insufficiency and reliance on support. We first distinguish by the household head’s race and ethnicity, comparing non-Hispanic whites and others. Then, to study the extent to which economic hardship is concentrated in lower-income neighborhoods, we characterize respondents by neighborhood average income, distinguishing between those living in zip codes with average adjusted gross income in the lowest quartile (under $46,584) and the highest quartile (over $79,836), and classifying the remainder as middle-income areas. The chart below reveals that while the share of households with children reporting food insufficiency is similar across race groups, it is lowest for those residing in the highest-income zip codes and highest in middle-income areas. Larger differences are found in the reliance on financial and food donations and government assistance, which are much higher for non-whites and monotonically decreasing in average zip-code income.

Summing up, we find evidence of disproportionate economic distress in households with children. Our results reveal high reliance by such households, and especially those headed by a single parent, on food and financial support from social networks as well as government assistance in the form of SNAP and unemployment benefits since the onset of the COVID-19 pandemic. While a greater reliance on assistance undoubtedly predates the pandemic, the high rates of job and income loss experienced by households with children has clearly heightened the importance of such support. Relatively low loan delinquency rates also point to the effectiveness of the various forbearance and other loan relief programs in mitigating so far household financial stresses stemming from the pandemic. It is likely that the economic health of households with children will continue to depend on this and other forms of assistance for at least the near future as the labor market begins to recover.
There are several important remaining questions regarding the implications of our findings for the pandemic’s impact on the wellbeing of children. Earlier research (here, here, here, and here) has documented the deleterious impact of food insecurity and economic distress on child development and health. Not addressed in our analysis so far are the many difficulties faced by parents in taking care of children at home with schools and childcare programs and facilities closed, and implications of combining these responsibilities with paid employment in single and two-parent households. We hope to study these issues in a future post.

Olivier Armantier is an assistant vice president in the Federal Reserve Bank of New York’s Research and Statistics Group.

Gizem Koşar is an economist in the Research and Statistics Group.

Rachel Pomerantz is a senior research analyst in the Research and Statistics Group.

Wilbert van der Klaauw is a senior vice president in the Research and Statistics Group.
How to cite this post:
Olivier Armantier, Gizem Koşar, Rachel Pomerantz, and Wilbert van der Klaauw, “The Disproportionate Effects of COVID-19 on Households with Children,” Federal Reserve Bank of New York Liberty Street Economics, August 13, 2020, https://libertystreeteconomics.newyorkfed.org/2020/08/the-disproportionate-effects-of-covid-19-on-households-with-children.html.
Disclaimer
The views expressed in this post are those of the authors and do not necessarily reflect the position of the Federal Reserve Bank of New York or the Federal Reserve System. Any errors or omissions are the responsibility of the authors.
 RSS Feed
 Follow Liberty Street Economics
Alan: Thank you for your interest and comments. 1. Does the households with children category include single parent households with children? Authors’ response: Yes 2. The composition of households without children also includes the young as well as older cohorts, including retires. Having said that, probably skewed toward the older cohorts given the 30% response reporting a decline in income even though only 19% reporting household job loss. That likely reflects asset income, which also leaks into households with children. Authors’ response: The group of households without children does indeed consist of a mix of those groups. Our (weighted) sample is nationally representative. It is important to note that beside job losses many households experience income losses due to a decline in working hours and cuts in earnings. We are collecting new data on non-labor income so we hope to have more insight into any declines in asset income in the future. 3. I would like to see the breakdown by race for the single parent households, given the high percentage of black single parent households. Authors’ response: Of the single parent w/kids households, 71.8% are female, 35.3% are non-white and 29.2% are female & non-white. Unfortunately we are unable to show all estimates separately for each subgroup of single parents because of small sample sizes. 4. The race breakdown would also be interesting for the income breakdown. Authors’ response: Agreed, but again sample sizes are not big enough to separate out and obtain precise enough statistics on non-whites.
Similar to the above comment. HH without children may have 1 or 2 earners. So really need to break it into 4 categories for apples-to-apples. To extrapolate, you also need to weight by how prevalent each category is. That is related to the demographics of each survey group relative to the total population.
1. Does the households with children category include single parent households with children? 2. The composition of households without children also includes the young as well as older cohorts, including retires. Having said that, probably skewed toward the older cohorts given the 30% response reporting a decline in income even though only 19% reporting household job loss. That likely reflects asset income, which also leaks into households with children. 3. I would like to see the breakdown by race for the single parent households, given the high percentage of black single parent households. 4. The race breakdown would also be interesting for the income breakdown