The COVID-19 pandemic has led to significant changes in banks’ balance sheets. To understand how these changes have affected the stability of the U.S. banking system, we provide an update of four analytical models that aim to capture different aspects of banking system vulnerability.
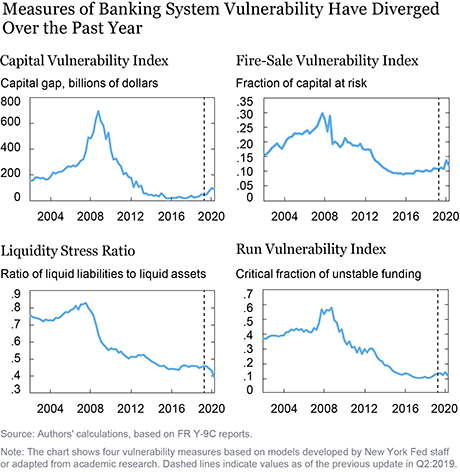
The four models, introduced in a Liberty Street Economics post in 2018 and updated in a post last year, monitor vulnerabilities of U.S. banking firms and the way in which these vulnerabilities interact to amplify negative shocks. Between 2017 and the beginning of 2020, the different models had followed a common, slowly increasing trend of higher vulnerability. With the unfolding of the COVID-19 pandemic, this worsening trend has continued for the capital vulnerability and fire-sale vulnerability measures, while the liquidity stress ratio decreased and run vulnerability remained almost unchanged.
How Do We Measure Banks’ Vulnerability?
We consider the following measures, all based on models developed by New York Fed staff or adapted from academic research. Measures are calculated for banks and bank holding companies (including intermediate holding companies). Institutions are collectively referred to as “banks” for simplicity in this post.
- Capital vulnerability. This index measures how well-capitalized the banks are projected to be after a severe macroeconomic shock. The measure is constructed using the CLASS model, a top-down stress testing model developed by New York Fed staff. Using the CLASS model, we project banks’ regulatory capital ratios under a macroeconomic scenario equivalent to the 2008 financial crisis. The vulnerability index measures the aggregate amount of capital (in dollars) needed under that scenario to bring each bank’s capital ratio to at least 10 percent.
- Fire-sale vulnerability. This index measures the magnitude of systemic spillover losses among banks caused by asset fire sales under hypothetical stress scenarios, and is expressed as a fraction of system capital. In a New York Fed Staff Report, “Fire-Sale Spillovers and Systemic Risk,” we show that an individual bank’s contribution to the index predicts its contribution to systemic risk five years in advance.
- Liquidity stress ratio. This ratio measures the potential mismatch between liquidity outflows and inflows. It is defined as the ratio of liabilities (with each liability category weighted by its expected outflow rate) to assets (with each asset category weighted by its expected market liquidity). The liquidity stress ratio grows when expected funding outflows are higher or assets are less liquid. If the ratio is high, liquid assets may be insufficient to meet expected outflows in stressful conditions.
- Run vulnerability. This measure gauges a bank’s vulnerability to runs, taking into account both liquidity and solvency. It combines a theoretical framework with projections of stress deterioration in bank capital from the CLASS model. An individual bank’s run vulnerability is the critical fraction of unstable funding that the bank needs to retain to prevent insolvency.
How Have Measures of Vulnerability Evolved Over Time?
The chart below shows how the different aspects of vulnerability have evolved since 2002, according to the four measures calculated for the fifty largest U.S. banks. The dashed lines indicate the values as of the previous update in the second quarter of 2019.

How Has the COVID-19 Pandemic Affected Banks?
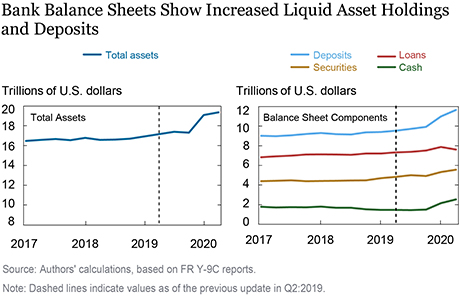
To understand the evolution of the vulnerability measures over the past year, we begin by documenting key changes in banks’ balance sheets in the chart below. Between the second quarter of 2019 and the second quarter of 2020, total assets of the banks in our sample increased by $2.2 trillion. The majority of that increase was in the form of a $1.1 trillion increase in cash and a $730 billion increase in securities, mostly Treasury securities and agency mortgage-backed securities (MBS). Combined with a smaller increase in loans ($290 billion), these changes resulted in a significant increase in the share of liquid assets on banks’ balance sheets. On the liabilities side, the balance sheet expansion was almost exclusively in the form of deposits ($2.1 trillion).

How Have These Changes Affected the Vulnerability Measures?
Capital vulnerability: The recent increase in this index reflects both short-term and longer-term trends. In particular, large capital payouts from 2017 to 2019 and weaker profitability since late 2018 contributed to the early increase in this vulnerability. More recently, the increase in net charge-offs caused by the COVID-19 pandemic, particularly in commercial real estate and commercial and industrial (C&I) lending, has contributed to the continuation of the upward trend.
Fire-sale vulnerability: The increase in total assets implies an increase in system size, and the concurrent increase in deposits implies an increase in leverage; both of these increases have led to an increase in this index. The increase has been moderated by a reduction in connectedness stemming from the increase in liquid assets being more pronounced among the largest banks.
Liquidity stress ratio: The concurrent increases in liquid assets and deposits have led to a net decrease in the liquidity stress ratio. On the assets side of the balance sheet, cash and cash-equivalent securities, which include Treasury securities, carry a liquidity weight of one (in other words, they are perfectly liquid). On the liabilities side, deposits carry liquidity weights smaller than one, as only a portion is expected to be withdrawn. As a consequence, the increase in liquid assets pushed the liquidity stress ratio down more than the concomitant increase in deposits pushed it up, leading to a net decrease.
Run vulnerability: Like the liquidity stress ratio, run vulnerability is affected by the liquidity of banks’ assets and the stability of their funding. The shift toward more liquid assets has exerted downward pressure on run vulnerability. At the same time, some of the increase in deposits has been in the form of unstable deposits such as non-interest-bearing and transaction accounts, which has partly offset the effect of more liquid assets. In addition, the deterioration in the stressed capital position predicted by the CLASS model has exerted upward pressure on run vulnerability. On net, the effects of more liquid assets on the one hand, but more unstable funding and higher stress leverage on the other, have led to a small decline in the run vulnerability index.
Summing Up
The largest change we measure in the last year is the increase in net charge-offs, which has resulted in an increase in the capital vulnerability index. The capital gap stands at $88 billion as of the end of the second quarter of 2020, reflecting the potential impact of a renewed deterioration in employment and the macroeconomic environment more broadly. While this gap is large relative to recent history, it remains below the levels seen in the run-up to the 2008 financial crisis due to the improved capitalization of banks post-crisis. Fire-sale vulnerability has also increased as the largest banks grow larger and more levered. However, elevated levels of these indexes are mitigated in part by decreases in the liquidity stress ratio. Combining the improved liquidity and deteriorated capital under stress, run vulnerability has remained almost unchanged.

Kristian Blickle is an economist in the Federal Reserve Bank of New York’s Research and Statistics Group.
Matteo Crosignani is an economist in the Research and Statistics Group.

Fernando Duarte is a senior economist in the Research and Statistics Group.

Thomas Eisenbach is a senior economist in the Research and Statistics Group.

Fulvia Fringuellotti is an economist in the Research and Statistics Group.

Anna Kovner is a policy leader for financial stability in the Federal Reserve Bank of New York’s Research and Statistics Group.
How to cite this post:
Kristian Blickle, Matteo Crosignani, Fernando Duarte, Thomas Eisenbach, Fulvia Fringuellotti, and Anna Kovner, “How Has COVID-19 Affected Banking System Vulnerability?,” Federal Reserve Bank of New York Liberty Street Economics, November 16, 2020, https://libertystreeteconomics.newyorkfed.org/2020/11/how-has-covid-19-affected-banking-system-vulnerability.html.
Disclaimer
The views expressed in this post are those of the authors and do not necessarily reflect the position of the Federal Reserve Bank of New York or the Federal Reserve System. Any errors or omissions are the responsibility of the authors.


 RSS Feed
 Follow Liberty Street Economics