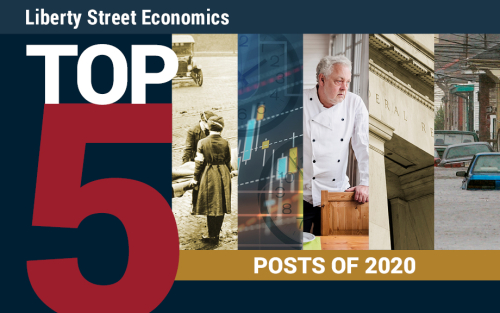
An annual tradition at Liberty Street Economics is to present our most‑read posts of the year. Given the events of 2020, New York Fed economists and guest coauthors focused their analysis on the effects of the coronavirus pandemic, writing some seventy articles since March on the subject. Our leading posts, in terms of traffic, all touch on the theme in some way. Consider this space a hub for COVID-19 coverage for some time to come, and take a look back at the top five posts grabbing attention in 2020.

Our top post of the year took on a topic of significant relevance for policymakers today: What are the economic costs of a pandemic and do closures and quarantines worsen the bite? A look at the U.S. experience of the 1918 flu pandemic yielded some insights. Although the regions worst hit in that outbreak fared poorly, cities that acted earlier and more aggressively with non-pharmaceutical interventions, such as social distancing, emerged stronger. For example, reacting ten days earlier to the arrival of the pandemic with forceful measures increased manufacturing employment in a given city by around 5 percent in the post-pandemic period. Regions with stronger commitment to interventions saw larger gains in manufacturing output and bank assets, too. (March 27)
By Sergio Correia, Stephan Luck, and Emil Verner

When the economy hits sudden headwinds, like the COVID-19 pandemic, conditions can evolve rapidly. To offer a timely signal, a New York Fed staff economist—along with coauthors at the Dallas Fed and Harvard—introduced a Weekly Economic Index (WEI), based on the common component of a small set of time series data reported daily and weekly. In this post, the team explains the methodology and documents the index’s performance since 2008, finding the estimates correspond well with the paths of other important macroeconomic aggregates. “It is clear that despite the noise inherent in the raw, high-frequency data, combining it to construct an index, as we do, provides an informative signal of real economic activity,” they wrote. (March 30)
By Daniel Lewis, Karel Mertens, and Jim Stock

In its first round, the Paycheck Protection Program (PPP), a central piece of the CARES Act, extended $349 billion in forgivable government-guaranteed loans to small businesses affected by the COVID-19 downturn. The program was quickly oversubscribed and lawmakers passed a new bill to replenish the fund with another $310 billion. Liu and Volker examined the allocation of credit in the first round and asked: Did PPP loans go to the areas of the country and sectors of the economy hardest hit by COVID‑19? (May 6)
By Haoyang Liu and Desi Volker
The coronavirus pandemic prompted the Federal Reserve to pledge in March to purchase Treasury securities and agency mortgage-backed securities “in the amounts needed” to support smooth market functioning and the effective transmission of monetary policy to the economy. But some market participants have called for more, suggesting that the Fed deploy a tool last used seventy-five years ago—direct yield curve control. This post looked back at the efforts of the Federal Open Market Committee to control the level and shape of the Treasury yield curve as a way to ease the burden of financing World War II. (April 6)
By Kenneth D. Garbade
In this analysis, our authors tracked the path of initial jobless claims data following the COVID-19 outbreak, finding a closer parallel with conditions in post–Hurricane Katrina Louisiana than in the period following the Great Recession. This observation formed a starting point for a larger discussion about the types of data and scenario analysis that are useful for understanding the effects of a shock hitting with full force suddenly versus a slower deterioration. (April 10)
By Jason Bram and Richard Deitz
 Anna Snider is a senior editor in the Federal Reserve Bank of New York’s Research and Statistics Group.
How to cite this post:
Anna Snider, “Understanding the Impact of COVID-19: The Top Five LSE Posts of 2020,” Federal Reserve Bank of New York Liberty Street Economics, December 23, 2020, https://libertystreeteconomics.newyorkfed.org/2020/12/understanding-the-impact-of-covid-19-the-top-five-lse-posts-of-2020.html.
Disclaimer
The views expressed in this post are those of the author and do not necessarily reflect the position of the Federal Reserve Bank of New York or the Federal Reserve System. Any errors or omissions are the responsibility of the author.


 RSS Feed
 Follow Liberty Street Economics