This is the fourth and final post in this series aimed at understanding the gap in COVID-19 intensity by race and by income. The previous three posts focused on the role of mediating variables—such as uninsurance rates, comorbidities, and health resource in the first post; public transportation, and home crowding in the second; and social distancing, pollution, and age composition in the third—in explaining the racial and income gap in the incidence of COVID-19. In this post, we now investigate the role of employment in essential services in explaining this gap.
Background
Ever since the pandemic hit and shelter-in-place and stay-at-home orders were issued, there has been a lot of discussion regarding essential services. Most states issued guidelines on which sectors and industries they consider “essential” despite pandemic-related closures. Following recent work, we use N.Y. Governor Andrew Cuomo’s list of essential industries for New York State as of March 22, 2020. These include retail, agriculture, construction, and health among others. We construct the proportion of essential workers to the total employment level in a county using the Quarterly Census of Employment and Wages (QCEW) published by the Bureau of Labor Statistics. We find that, on average, about 64 percent of the workforce in a county is classified as essential workers.
Essential Work and the COVID-19 Racial and Income Gap
For this measure to have explanatory power for the racial and income gap observed in COVID-19 incidence, it is important to look at the correlation with the low-income and majority-minority (MM) status of counties. We define low-income and MM counties in the same way as in the earlier posts in this series. We find that MM counties have a higher proportion of essential workers, and so do low-income counties, although this relationship is stronger for MM counties.
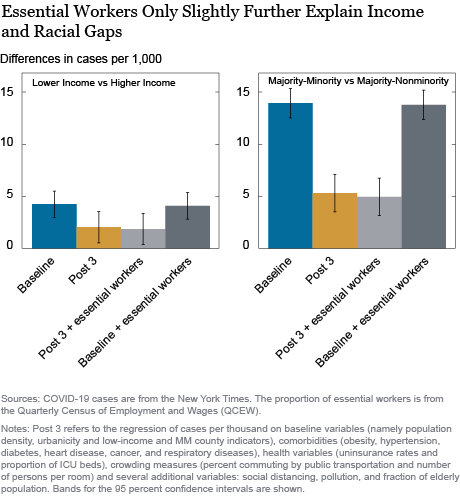
In order to get a better sense of how much the share of essential workers explains the racial and income gap in COVID-19 occurrence, we perform multivariate regression analysis similar to those in the earlier posts in this series. The bars in blue are the baseline results from regressing cases per thousand, as of December 15, on population density and MM, low-income and urbanicity indicators. The bars in gold report the most comprehensive regressions from the previous post, while the bars in light gray add the share of essential workers to this set of variables. The last bars in dark gray include the baseline set of variables that we started with in the first post of this series (low-income, MM, urbanicity, and population density) and augment this set by the share of essential workers.

The basic regressions in the first post showed that cases per thousand were much higher in low-income and MM counties. These differences were about 4.2 extra cases in low-income counties and 14 extra cases in MM counties, all statistically significant. Thus subsequent posts in the series looked at introducing numerous controls to explain this gap. So far, by controlling for comorbidities, uninsurance, ICU beds, public transit, home crowding, social distancing, pollution, and the fraction of elderly, we found that the differentials declined considerably, but remained statistically significant for both the income and racial gaps. These estimates are shown in the bars in gold.
Moving to the light gray bars, the estimates reported show the effect of controlling for the share of essential workers, while continuing to include the variables considered so far. For cases per thousand, the introduction of the share of essential workers actually dropped the level of statistical significance from 1 percent to 5 percent for the low-income gap. It also lowered the magnitude of the MM gap slightly. This seems to suggest that while this mediating variable has explanatory power for reported COVID-19 cases, it does not provide much additional information on the reasons behind the racial and income gap after the other variables we have discussed in the series have been accounted for. Compared to the original estimates, the inclusion of all potential factors reduces the low-income coefficient by 56 percent and the racial differential by 65 percent.
The last bars in dark gray report estimates where COVID cases are regressed only on the baseline characteristics and share of essential workers. This is done to assess the contribution of the share of essential workers on its own. Although the coefficients on share of essential workers are positive and statistically significant for cases, it is important to note that the low-income and racial differentials remain statistically significant. Compared to the baseline results from the first post, the only change is the slight reduction in magnitudes of all the differentials. This suggests that although the share of essential workers is important to explain COVID-19 incidence, it does not explain much of the racial and income gap on its own.
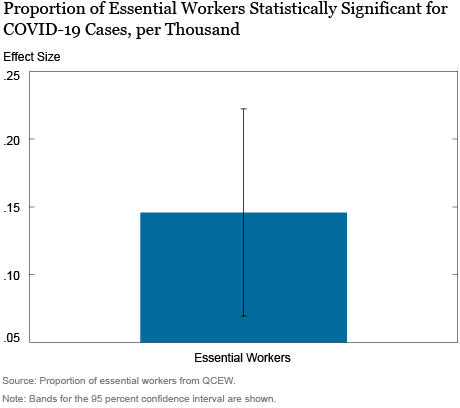
When looking at the association between COVID-19 cases and the share of essential workers conditional on the other determinants of COVID-19 cases investigated in the first three posts of the series, we find that counties with a higher share of essential workers also have higher COVID-19 intensity. As shown below, the coefficient on the share of essential workers in a county is positive and statistically significant. Thus, we find that counties with a higher share of essential workers are more vulnerable to COVID-19 effects. We also find that minority areas are more likely to have a higher share of essential workers. Yet, inclusion of this variable does not seem to explain the racial and income gap much more after a rich set of other covariates are accounted for.

Conclusion
To sum up, this series of posts investigated the potential determinants of the notable racial and income disparities in COVID-19 intensity across the United States. We used multivariate regression analysis to look at the ability of each factor to explain these disparities both on its own and in conjunction with other potential determinants of COVID-19 intensity. Our most notable finding is that while comorbidities play a role in explaining COVID-19 intensity gaps, factors amenable to policy interventions—most notably health insurance, but also home crowding and early social distancing in the pandemic—play key roles in both explaining COVID-19 intensity as well as the income and, to a lesser extent, the minority gap. While our analysis is not causal, our findings help focus attention on key determinants of spread, addressing which may help reduce the impact of COVID-19 on communities that are the hardest hit by the pandemic.
Ruchi Avtar is a senior research analyst in the Federal Reserve Bank of New York’s Research and Statistics Group.
 Rajashri Chakrabarti is a senior economist in the Bank’s Research and Statistics Group.

Maxim Pinkovskiy is a senior economist in the Bank’s Research and Statistics Group.
How to cite this post:
Ruchi Avtar, Rajashri Chakrabarti, and Maxim Pinkovskiy, “Understanding the Racial and Income Gap in COVID-19: Essential Workers,” Federal Reserve Bank of New York Liberty Street Economics, January 12, 2021, https://libertystreeteconomics.newyorkfed.org/2021/01/understanding-the-racial-and-income-gap-in-covid-19-essential-workers.html.
Disclaimer
The views expressed in this post are those of the authors and do not necessarily reflect the position of the Federal Reserve Bank of New York or the Federal Reserve System. Any errors or omissions are the responsibility of the authors.


 RSS Feed
 Follow Liberty Street Economics