The surge in inflation since early 2021 has sparked intense debate. Would it be short-lived or prove to be persistent? Would it be concentrated within a few sectors or become broader? The answers to these questions are not so clear-cut. In our view, one should ask how much of the inflation is persistent and how much of it is broad-based. In this post, we address this question through a quantitative lens. We find that the large ups and downs in inflation over the course of 2020 were largely the result of transitory shocks, often sector-specific. In contrast, sometime in the fall of 2021, inflation dynamics became dominated by the trend component, which is persistent and largely common across sectors.
A Multivariate Core Trend of PCE Inflation
To address the issues of inflation persistence and broadness, we estimate a dynamic factor model on monthly data for the seventeen major sectors of the personal consumption expenditures (PCE) price index. The model (which builds on this paper) decomposes each sector’s inflation as the sum of a common trend, a sector-specific trend, a common transitory shock, and a sector-specific transitory shock. From sectoral level estimates, we then construct the trend in PCE inflation as the sum of the common and sector-specific trends weighted by the expenditure shares. We estimate the model using data from all sectors; however, in constructing the trend in PCE inflation, we exclude the non-core sectors (that is, food and energy). We thus refer to the measure as a Multivariate Core Trend (MCT) of PCE inflation.
Compared to the widely used core PCE inflation measure, which simply removes the volatile components, the MCT seeks to further remove the transitory variation from the core sectoral inflation rates. This is key in understanding recent inflation developments because during the pandemic many core sectors (motor vehicles and furniture, for example) were hit by unusually large transitory shocks. An ideal measure of inflation persistence should filter those out.
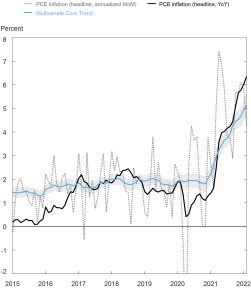
The chart below reports our estimated MCT (light blue line) alongside monthly headline PCE inflation (annualized, grey line) and the twelve-month change in headline PCE prices (black line). The shaded area around the MCT is a 68 percent band that captures the uncertainty associated with the estimate. A few features of the estimated trend are worth highlighting.
PCE Inflation and Multivariate Core Trend

First, the trend hovers below but close to 2 percent from early 2016 through late 2020 and remains remarkably stable in the face of negative inflation numbers at the onset of the pandemic. The increasingly high inflation readings in mid-2021 are instead dominated by increases in the trend, which moves up rapidly to reach about 5 percent in February 2022.
Second, both month-to-month price changes and twelve-month inflation display notable transitory variation. The most recent reading of headline PCE, at 6.4 percent, is well outside the 68 percent probability interval for the estimated trend, which goes from 4.5 to 5.5 percent. In fact, twelve-month inflation often deviates substantially from our estimated trend because of the presence of outliers and because, in some sectors, the effect of transitory shocks takes a few months to dissipate. Note that the standard core PCE measure also retains some transitory elements, often falling outside the band of our estimated trend.
Overall, the increase in the estimated trend—of about 3.2 percentage points (ppts) relative to its pre-pandemic average—indicates that inflation has become notably more persistent. Where does this increase in persistence come from?
Are There Sectors that Contribute Disproportionately to the Recent Increase in Trend?
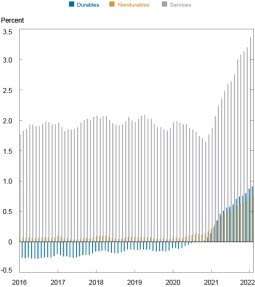
To quantify the contribution of different sectors and different components (that is, common versus sector-specific) to the increase in trend, we start by constructing trends for the broad aggregates of durables, nondurables, and services. We then recover the incidence of each of these sectors on the overall trend (defined as the sectoral trend scaled by the corresponding expenditure share) to evaluate the role that these different sectors played in its recent increase (see the chart below).
The incidence of durables (blue) went from a pre-pandemic negative, of roughly -0.2 ppt, to positive, at +0.9 ppt, implying a contribution to the increase in trend of 1.1 ppts as of the last data release. By the same type of calculation, nondurables (gold) explain 0.6 ppt of the increase in trend (going from slightly under 0.1 ppt pre-pandemic to 0.7 ppt currently), and services (grey) account for 1.5 out of the total 3.2 ppts of trend increase (from 1.9 to 3.4 ppts).
Inflation Trend Decomposition by Sector

The incidence of durables on the current trend (0.9 ppt) is notable by historical standards but is significantly lower than their disproportionate incidence on twelve-month core inflation numbers—which totaled 1.6 ppts in February. This is owed to our model attributing nearly half of the inflation in durables to highly volatile transitory shocks to the sector and to outliers. The narrative for core services is quite different: their incidence on the twelve-month core inflation, at 3.2 ppts, is more in line with their incidence on the trend, suggesting a smaller role of the transitory component and some attenuation coming from sector-specific trends.
If we look at the increase in trend inflation since pre-pandemic levels, the contribution of durables (1.1 ppts) and services (1.5 ppts) are of comparable magnitude. In other words, according to our model, the increase in the persistence of inflation is not explained by a single sector or group of sectors but is more pervasive.
How Widespread Are the Trend Dynamics?
Since sectors display heterogeneous persistent and transitory price movements, a complementary perspective distinguishes between changes in trend that are common across sectors and changes that are idiosyncratic, or sector-specific. We think of the common trend as capturing economy-wide macro factors; idiosyncratic trends, on the other hand, represent developments of a more micro nature. While both play a role in explaining inflation dynamics, our model can quantify changes over time in their relative importance.
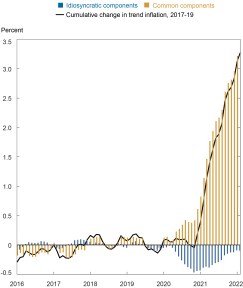
The next chart illustrates this point by allocating the cumulative change in trend inflation (measured from its average 2017-19 level and displayed as a solid black line) to common and sector-specific components. We focus on cumulative changes between the pre-pandemic and current periods as opposed to the levels of the components since the locations of the latter are pinned down by an arbitrary normalization for the purpose of estimation.
Inflation Trend Decomposition by Component

We can see that the cumulative change in trend is currently dominated by its common component (gold), with the aggregate contribution of the idiosyncratic trends (blue) playing a smaller role. The dynamics, however, evolved significantly during the pandemic. The relative stability of the trend during 2020, for example, occurred as common and idiosyncratic trends pulled in opposite directions. In the second half of 2021, however, the common trend component continued to rise while opposing forces of the idiosyncratic trends diminished, leading to a sizable rise in the inflation trend.
Concluding Comments
As the recent surge in inflation has endured, it has triggered a series of narrative shifts—price increases were initially deemed to be transitory, then they were tied to developments in specific sectors and changes in consumption patterns, and now inflation is acknowledged to be a broad-based phenomenon.
In this post, we provide a model-based perspective on this narrative: large increases and decreases in monthly inflation during 2020 were largely the result of transitory shocks and outliers, with the trend component remaining relatively stable until early 2021, as common and sector-specific forces pulled in opposite directions. Sometime in the fall of 2021, the common persistent component came to dominate the evolution of the trend and today it stands as a significant driver of inflation. Sector-specific movements may have been relevant at the beginning of the pandemic but are currently playing a smaller role than common dynamics.
Of course, the preceding assessment uses all available data as of April 2022 and therefore has the benefit of hindsight. Even though the model captured early on the persistent nature of inflation movements, today’s interpretation is subject to much less uncertainty than what the model suggested in real time.

Martín Almuzara is an economist in the Federal Reserve Bank of New York’s Research and Statistics Group.

Argia Sbordone is a vice president in the Bank’s Research and Statistics Group.
How to cite this post:
Martin Almuzara and Argia Sbordone, “Inflation Persistence: How Much Is There and Where Is It Coming From?,” Federal Reserve Bank of New York Liberty Street Economics, April 20, 2022, https://libertystreeteconomics.newyorkfed.org/2022/04/inflation-persistence-how-much-is-there-and-where-is-it-coming-from/.
Disclaimer
The views expressed in this post are those of the authors and do not necessarily reflect the position of the Federal Reserve Bank of New York or the Federal Reserve System. Any errors or omissions are the responsibility of the authors.


 RSS Feed
 Follow Liberty Street Economics